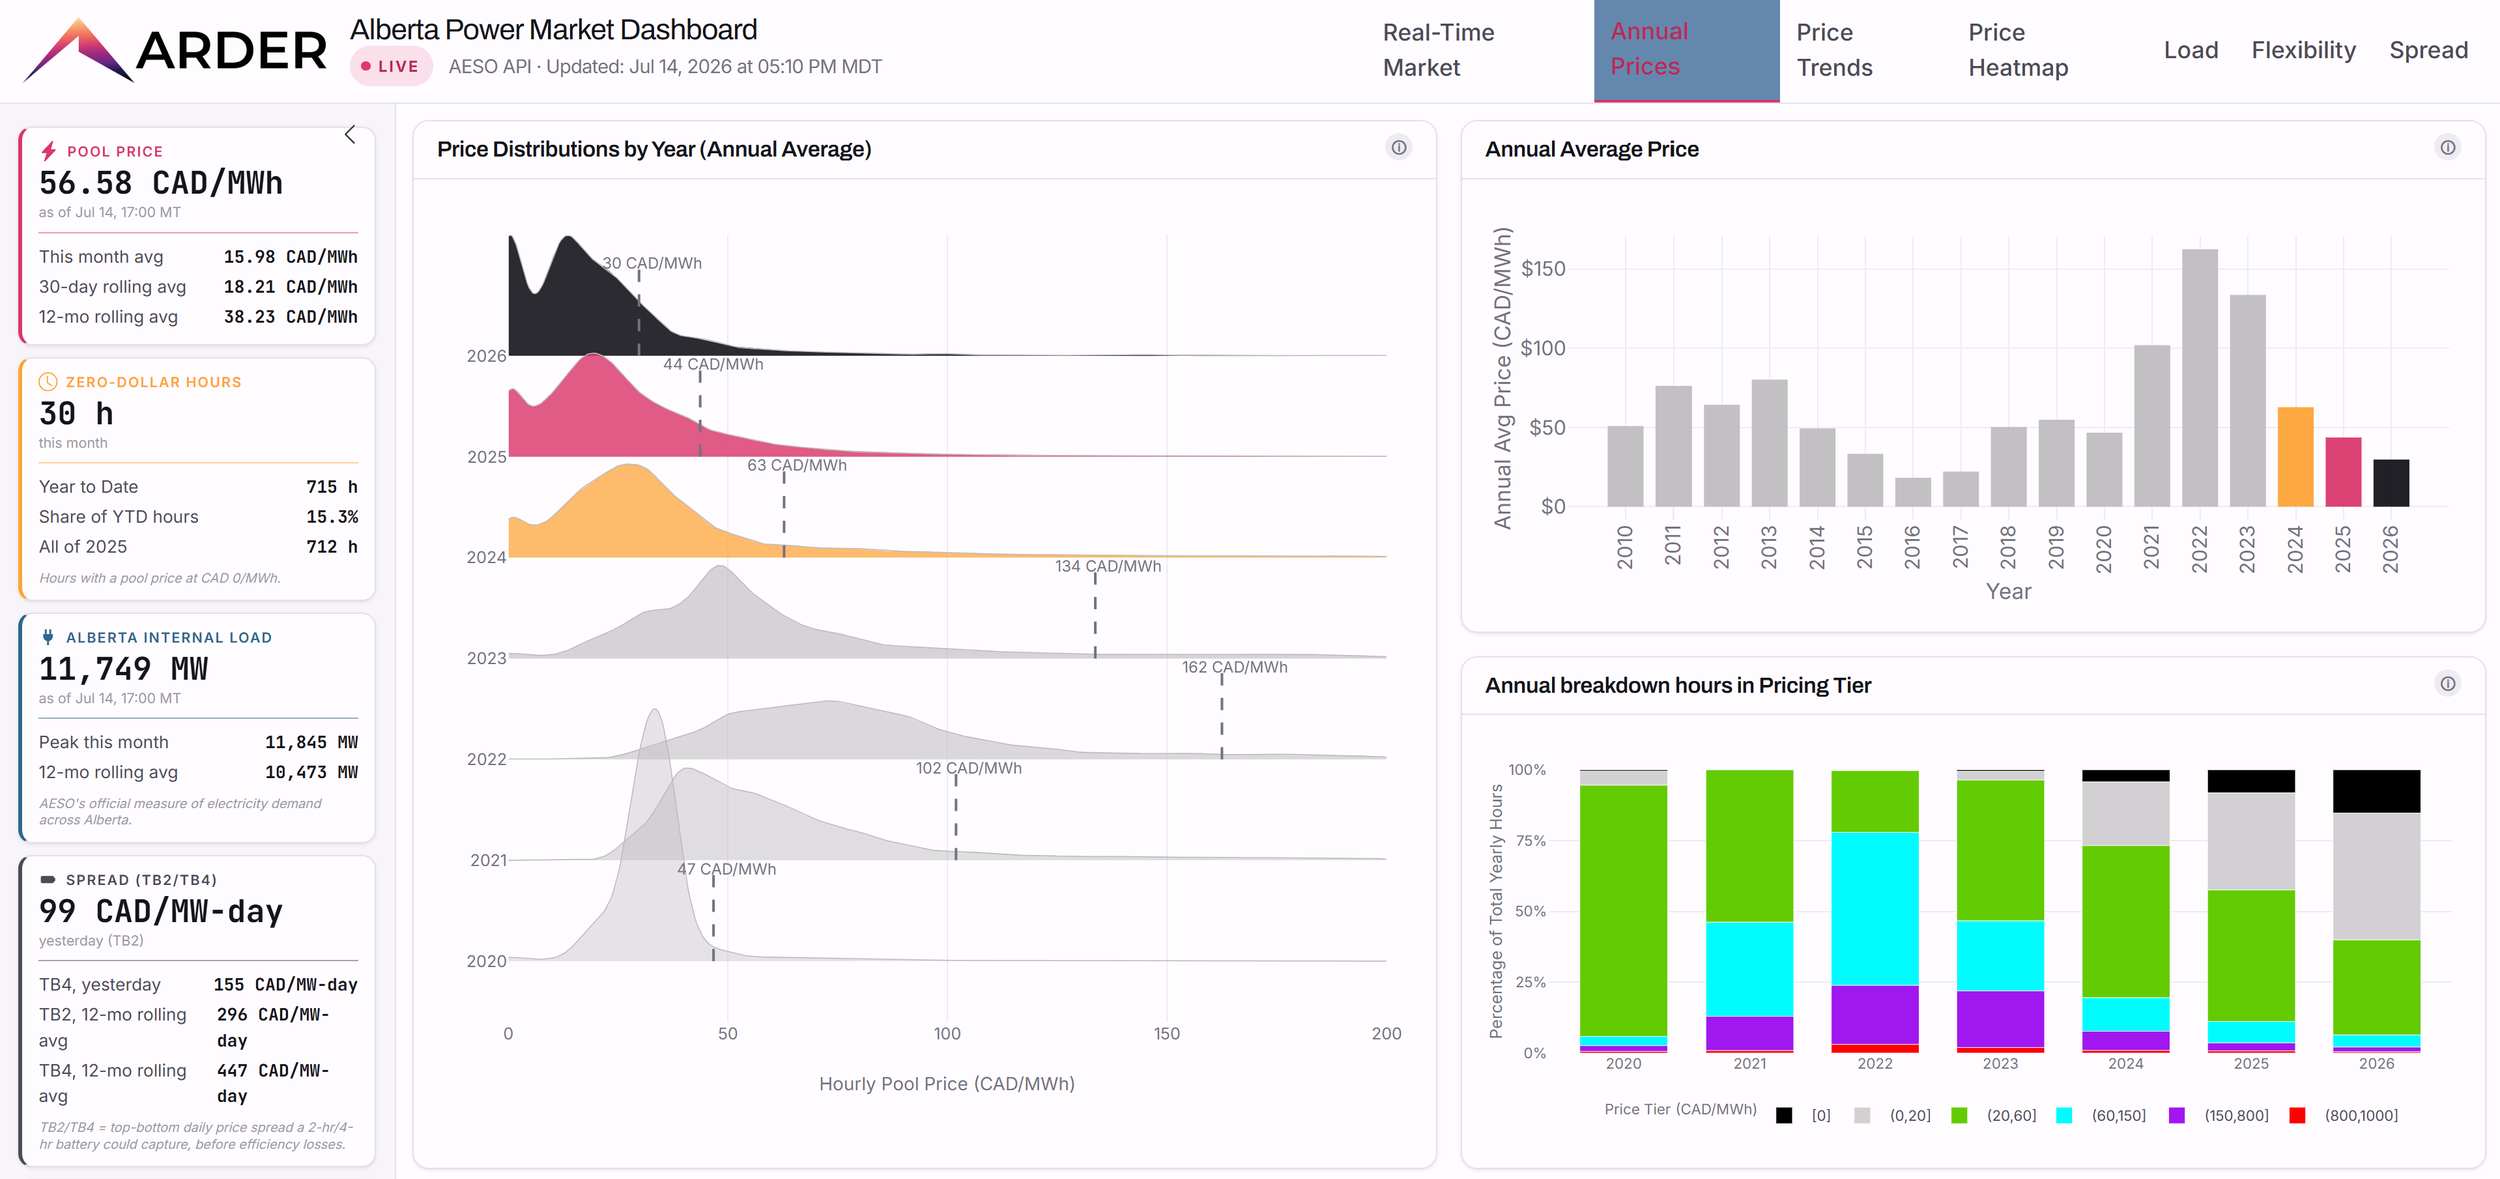
Alberta Power Market Snapshot: July 2026
It was an active month in Alberta’s power market. Average Alberta Internal Load (AIL) rose 7.1% compared to last July, setting a new hourly summer peak record. Despite the surging demand, average prices remained subdued—landing less than 8 cents per MWh above last July’s level—supported by a new July record for zero-dollar hours.
Here is our snapshot of the data and the defining trends.
This article is for general informational purposes only and does not constitute financial, investment, or professional advice. Information is subject to change without notice and should not be relied upon for decision-making.
© 2026 Arder Energy™. All rights reserved.See Webpage Terms of Use.
The Data
As usual, let’s start with the big picture, and weather is of course key to summer power demand patterns. July 2026 across Alberta brought above-average warmth paired with localized severe weather and historic rainfall in central regions. While southern districts experienced a typical warm Prairie summer, central corridors were hit by frequent thunderstorm tracks.
The monthly price heatmap highlights a now-familiar pattern: persistent zero-dollar hours (black) alongside widespread extremely low (grey) and low (green) pricing, punctuated only by brief, sporadic spikes into high (purple) and peak (red) territory.
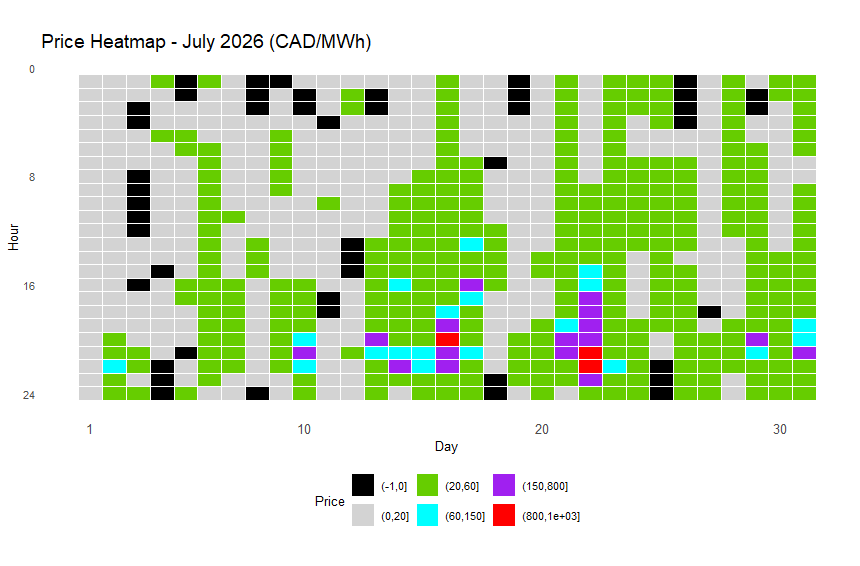
Heat Map of July 2026 hourly Alberta power pool prices
Black: zero dollar hour - “Excess Supply”
Light Grey: CAD 0.01 - 20/MWh - “Insufficient”
Green: CAD 20.01 - 60/MWh - “Marginal”
Cyan: CAD 60.01 - 150/MWh - “Full-cycle”
Purple: CAD 150.01 - 800/MWh - “Expensive”
Red: CAD 800.01 - 999.99/MWh - “Peak”
Accordingly, the average wholesale power price settled at CAD 31.26/MWh, virtually flat compared to CAD 31.19/MWh last July. This price level remains insufficient to recover the full-cycle cost of any power generation technology—a situation the market has now faced for well over a year. But as we can see from the chart comparing July average prices over the last 2 decades, while this average price level is low, it is neither unprecedented nor a new all-time record (note though that these figures are not inflation adjusted - if they were, then this year would be near the all-time low level).
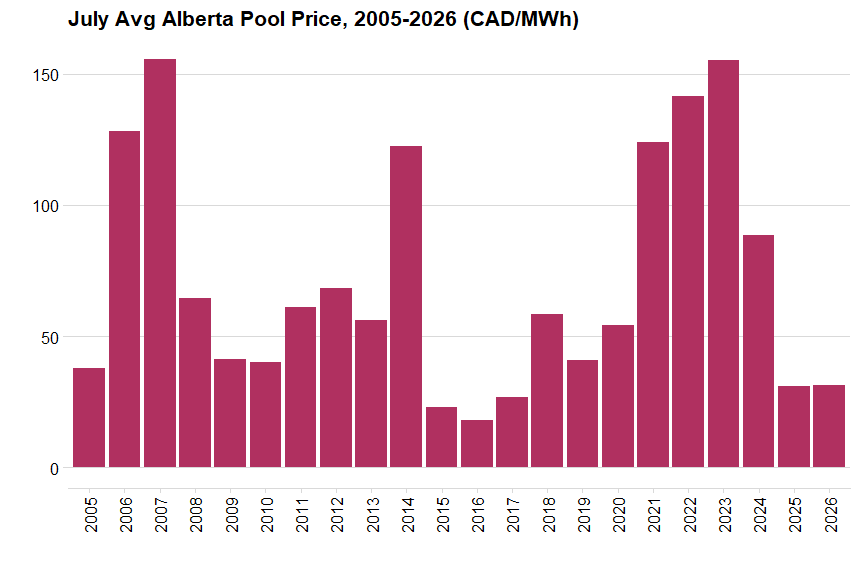
July average Alberta electricity pool prices, 2005-2026 (CAD/MWh)
Prices are not inflation-adjusted
This is being driven by the same trend we have tracked for the last two years, and it is accelerating: a rapidly growing volume of extremely low-price and zero-dollar hours. As a result, our proxy for the average cost of highly flexible loads—the average cost of the daily lowest-cost 8 hours—hit a new all-time July record at a mere CAD 9.57/MWh.
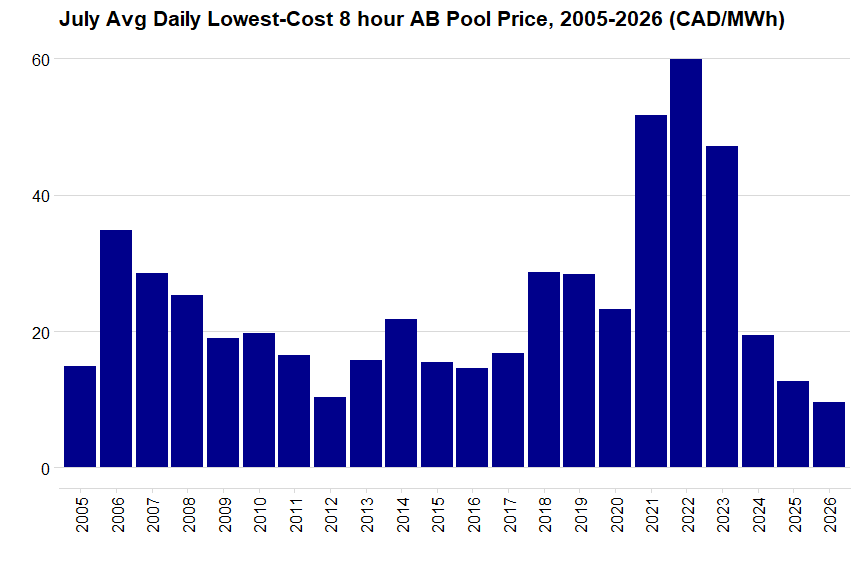
Daily lowest-cost 8 hours, average for July, 2005-2026 (CAD/MWh)
Prices are not inflation-adjusted
And July saw 46 zero-dollar hours, far surpassing the previous July record of 19 set just last year.
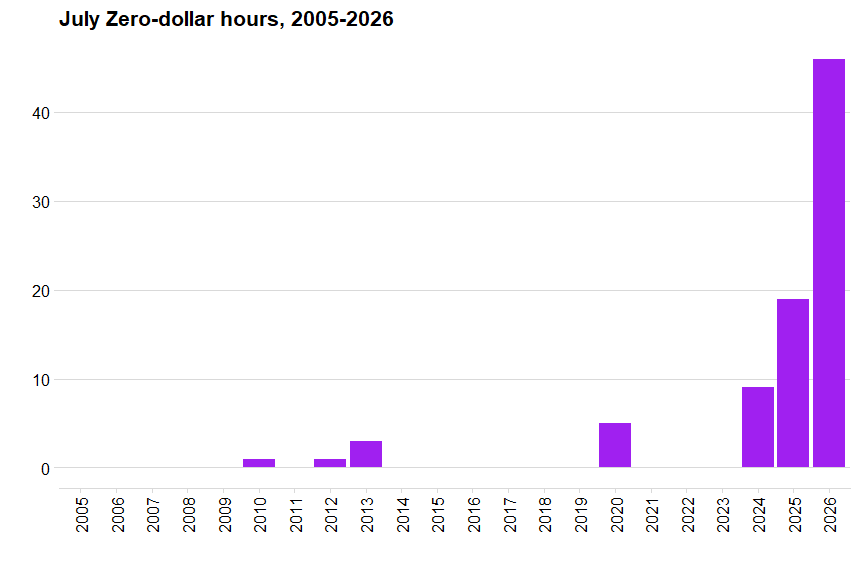
Monthly zero-dollar hours for July, 2005-2026
This pricing environment is particularly notable given the backdrop of record consumption. Average AIL jumped 7.1% year-over-year to 10,721 MW. Part of this surge reflects a bounce back from an unseasonably cold July 2025, which had dropped load by 3.8%. On a 3-year annualized trend, growth sits at 2.7%—above the 1.8% long-term average, but far more sustainable than the raw single-year spike.
However, system stress peaked on July 17th with a new summer record of 12,390 MW. Remarkably, this hot-weather peak edged out the previous all-time system record of 12,384 MW set during the January 12, 2024 winter freeze.
The market response between these two peaks, however, highlights how fundamentally the grid dynamics have shifted. During the January 2024 record, the pool price cleared at CAD 629.01/MWh. During this new July 2026 record, the pool price was just CAD 92.70/MWh. This highly subdued peak price was the direct result of a lack of outages on the gas-fired system, perfectly paired with strong contributions from renewables.
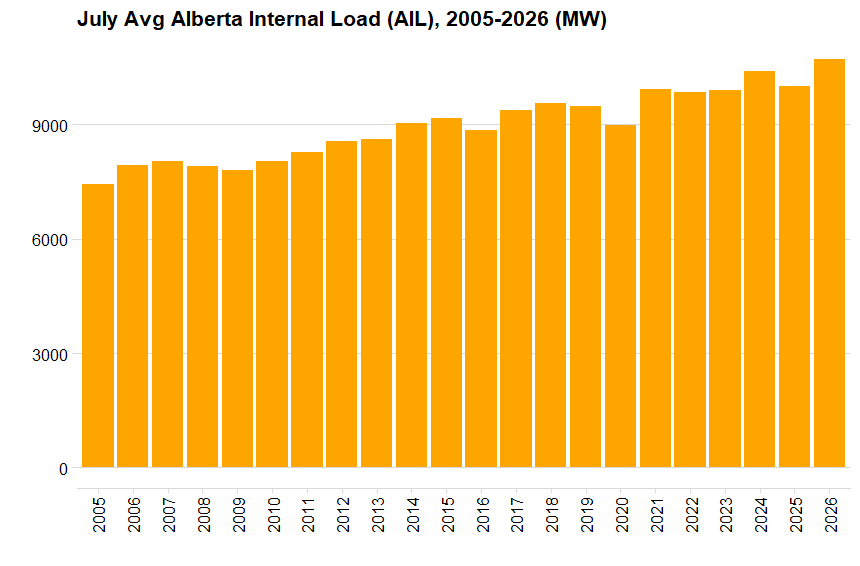
Avg Alberta Internal Load (AIL) for July, 2005-2026 (MW)
Implications
Once again, we see a market defined by compounding extremes. For power consumers and deal teams, the implications are clear:
Short-Term Continuity: There is no immediate end in sight to unsustainably low power prices and the escalating frequency of zero-dollar hours. Based on the current trajectory, we are well on track to exceed our previous prediction of over 1,000 zero-dollar hours for the year.
The Value of Flexibility: For industrial loads, this operational reality means that flexibility is becoming increasingly valuable. The ability to shift or increase load during low-priced hours creates unique opportunities to generate a competitive advantage that simply did not exist just a few years ago.
Medium-to-Long-Term Rebound: It is critical to remember that current spot price levels will not last in the medium to long term. With incoming demand growth and structural changes on the horizon, forward prices for the end of the decade are already trading 70%+ above current price levels.
The "good old days" of set-and-forget power procurement are over. Large consumers can no longer afford to remain passive—because the competition certainly is not.
📊 ArderInsights Platform: From Market Metrics to Operational Strategy
Good strategies require good data. The ArderInsights Platform translates complex Alberta power metrics into operational realities, providing industry and investors with foundational market intelligence.
📈 1. Free & Premium Market Dashboards
Free Dashboard: Live tracking of Alberta Power Market pricing, zero-dollar hour frequency, and load dynamics.
Premium Dashboard: Advanced tracking of price, load and flexibility metrics, with optional private data integration.
📋 2. Regular Market Reports
Detailed monthly reports featuring price distributions, load flexibility, and TB2/TB4 arbitrage analytics, delivered promptly after month-end, available to Members through our platform.
🎓 3. On-Demand Training
Foundational capacity-building online training modules designed to establish a solid baseline across technical, commercial and regulatory power market aspects, available to Members through our platform.