
Last month, we saw Alberta pool prices settle notably higher than the previous two years, driven by robust load growth, less renewable power generation and fewer intertie outages. As the market digests these shifting supply dynamics and persistent localized transmission constraints, forward curves suggest the current low-price environment is likely transitory.
This article is for general informational purposes only and does not constitute financial, investment, or professional advice. Information is subject to change without notice and should not be relied upon for decision-making.
© 2026 Arder Energy™. All rights reserved. See Webpage Terms of Use.
The Price Environment
Overall, October's price levels were notably higher than in the last two years. The price heatmap shows large blocks of "green" hours at the beginning and especially the end of the month, denoting times when power prices are very low (CAD 20-60/MWh) yet sufficient for most power generators to at least recover their half-cycle cost (fuel plus operating expenses):
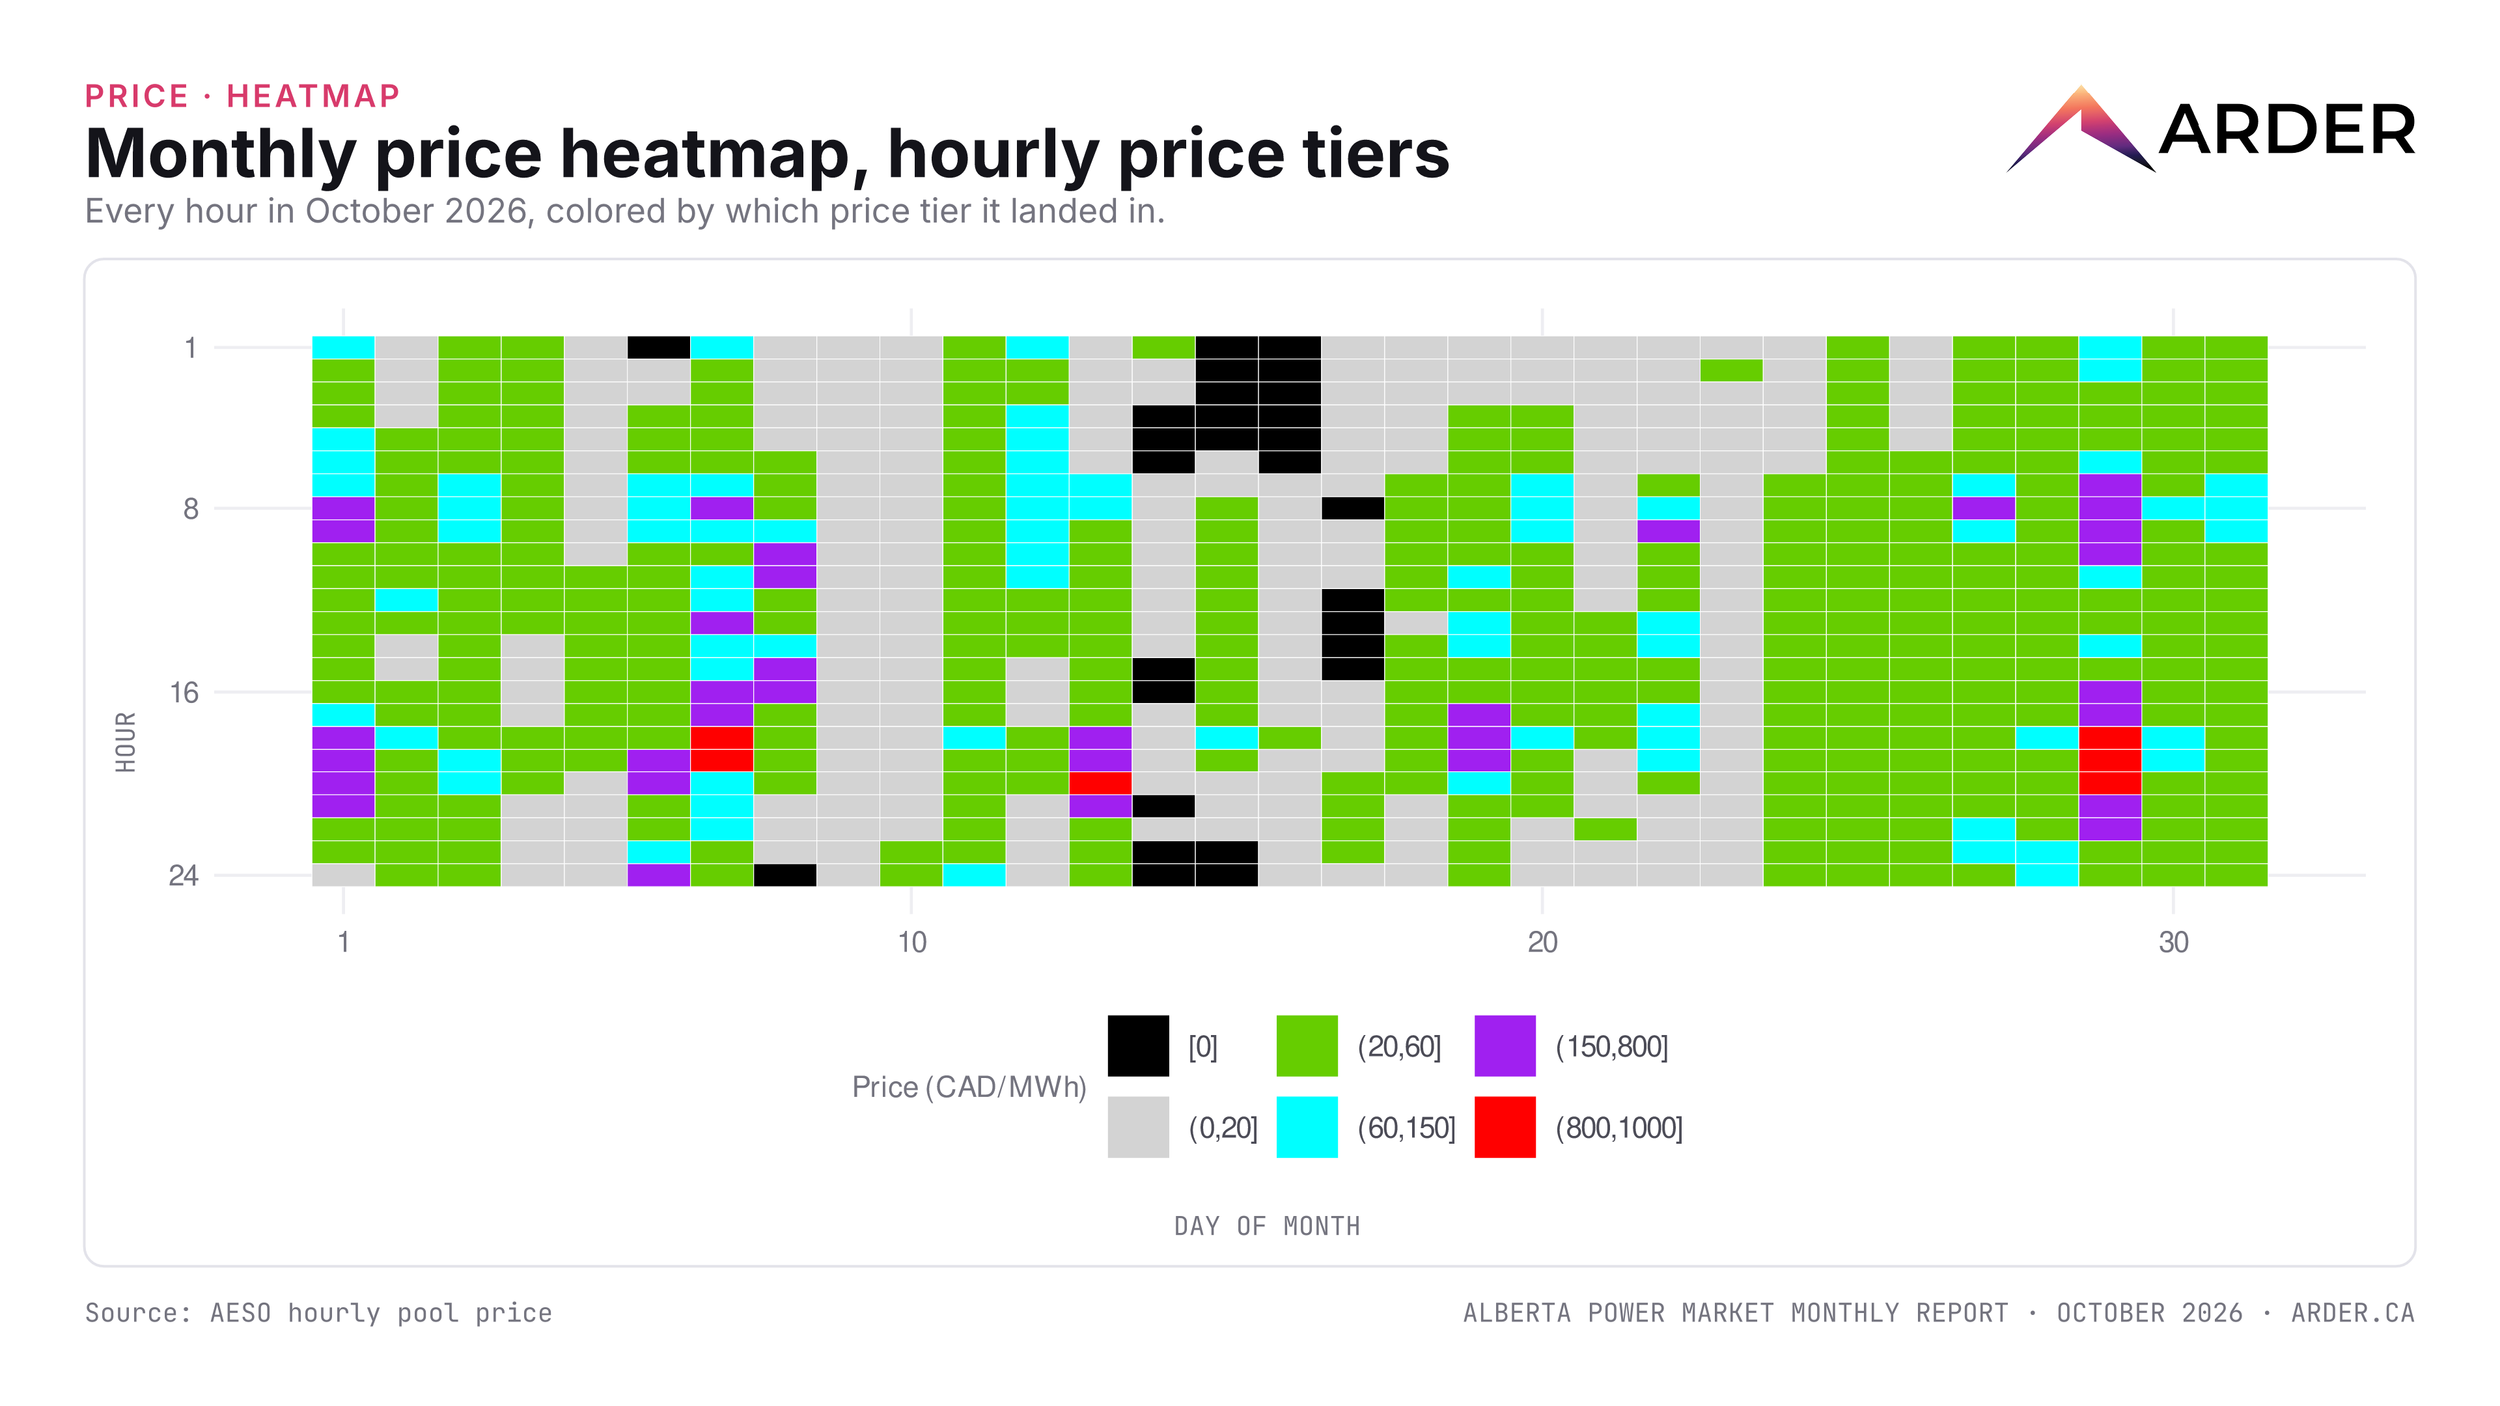
Also notable are the blocks of zero-dollar hours around October 14-17, driven by very strong winds, unseasonably warm weather during the first couple of those days, and lower demand heading into the weekend (October 17 was a Saturday). Note the absence of zero-dollar hours during the rest of the month, other than a single such hour on October 6 and 8, replaced instead by a significant number of high and peak price periods shown in purple and red. These peak price hours are tightly concentrated around the morning and evening ramp periods, times when overall system demand peaks yet solar generation has either not yet started or is rapidly winding down.
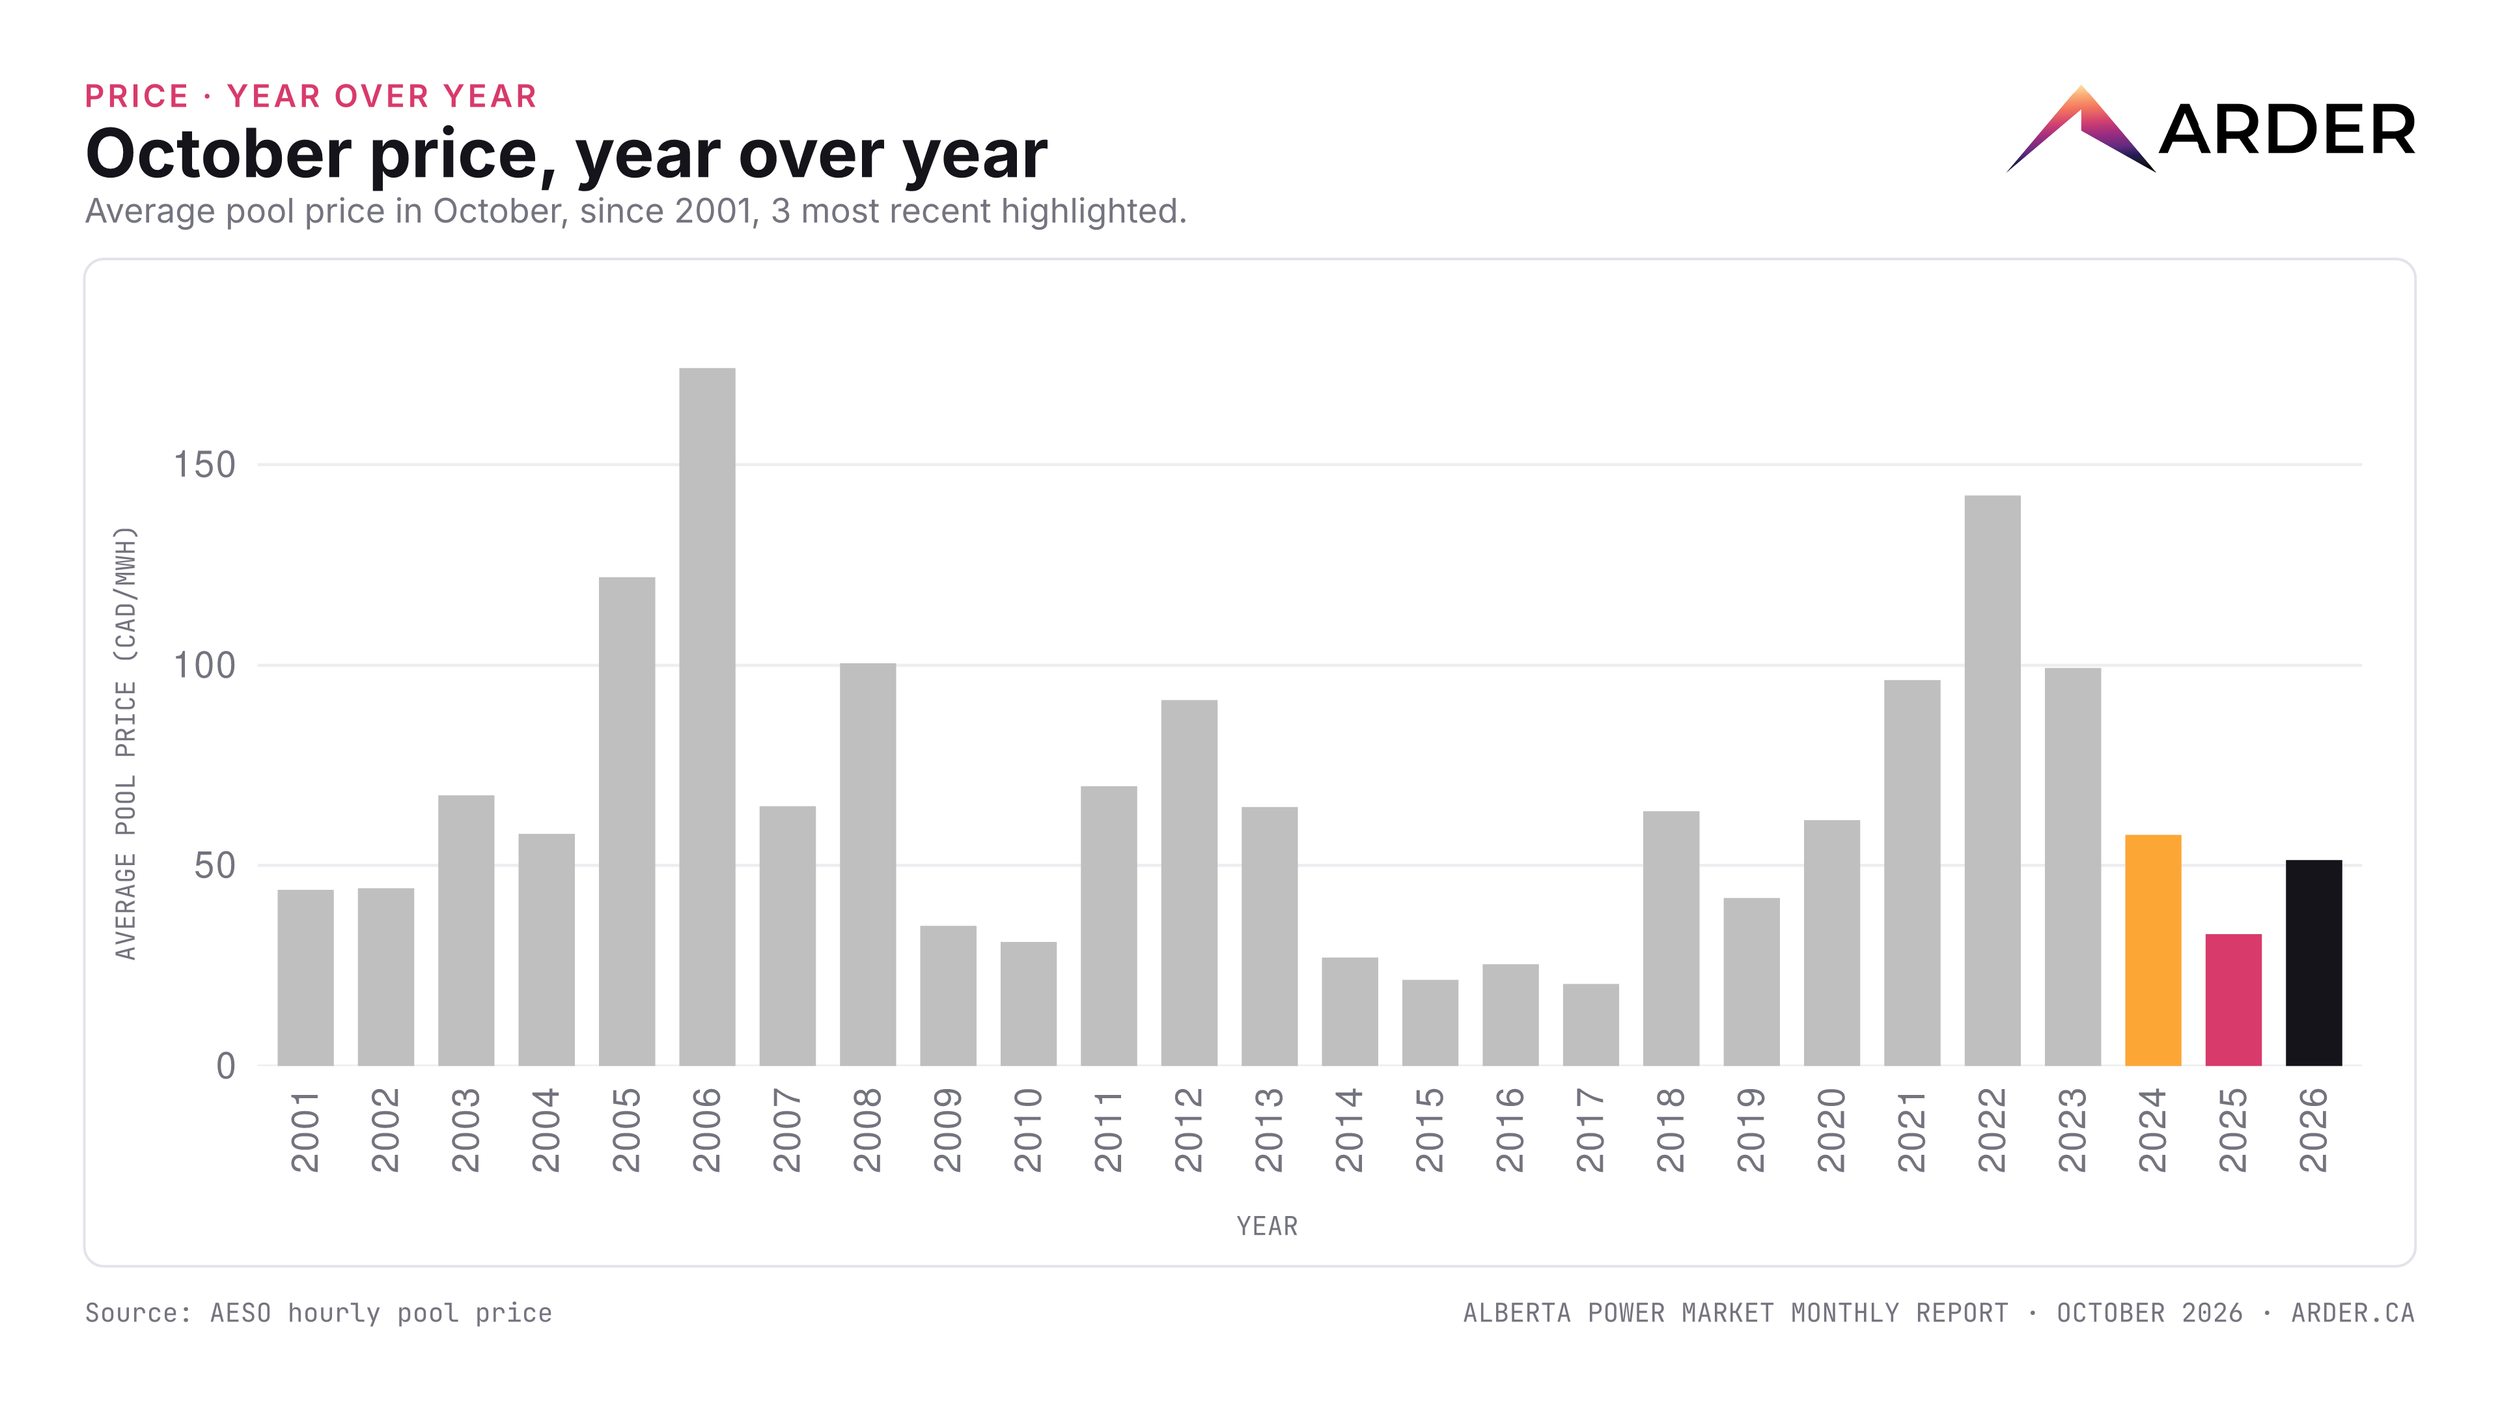
The average pool price accordingly settled higher at CAD 51.33/MWh, 56.1% above last October's CAD 32.88/MWh and 40.9% above the 12-month average of CAD 36.44/MWh:
Zero-dollar hours were much lower at 28 versus last October's 129:
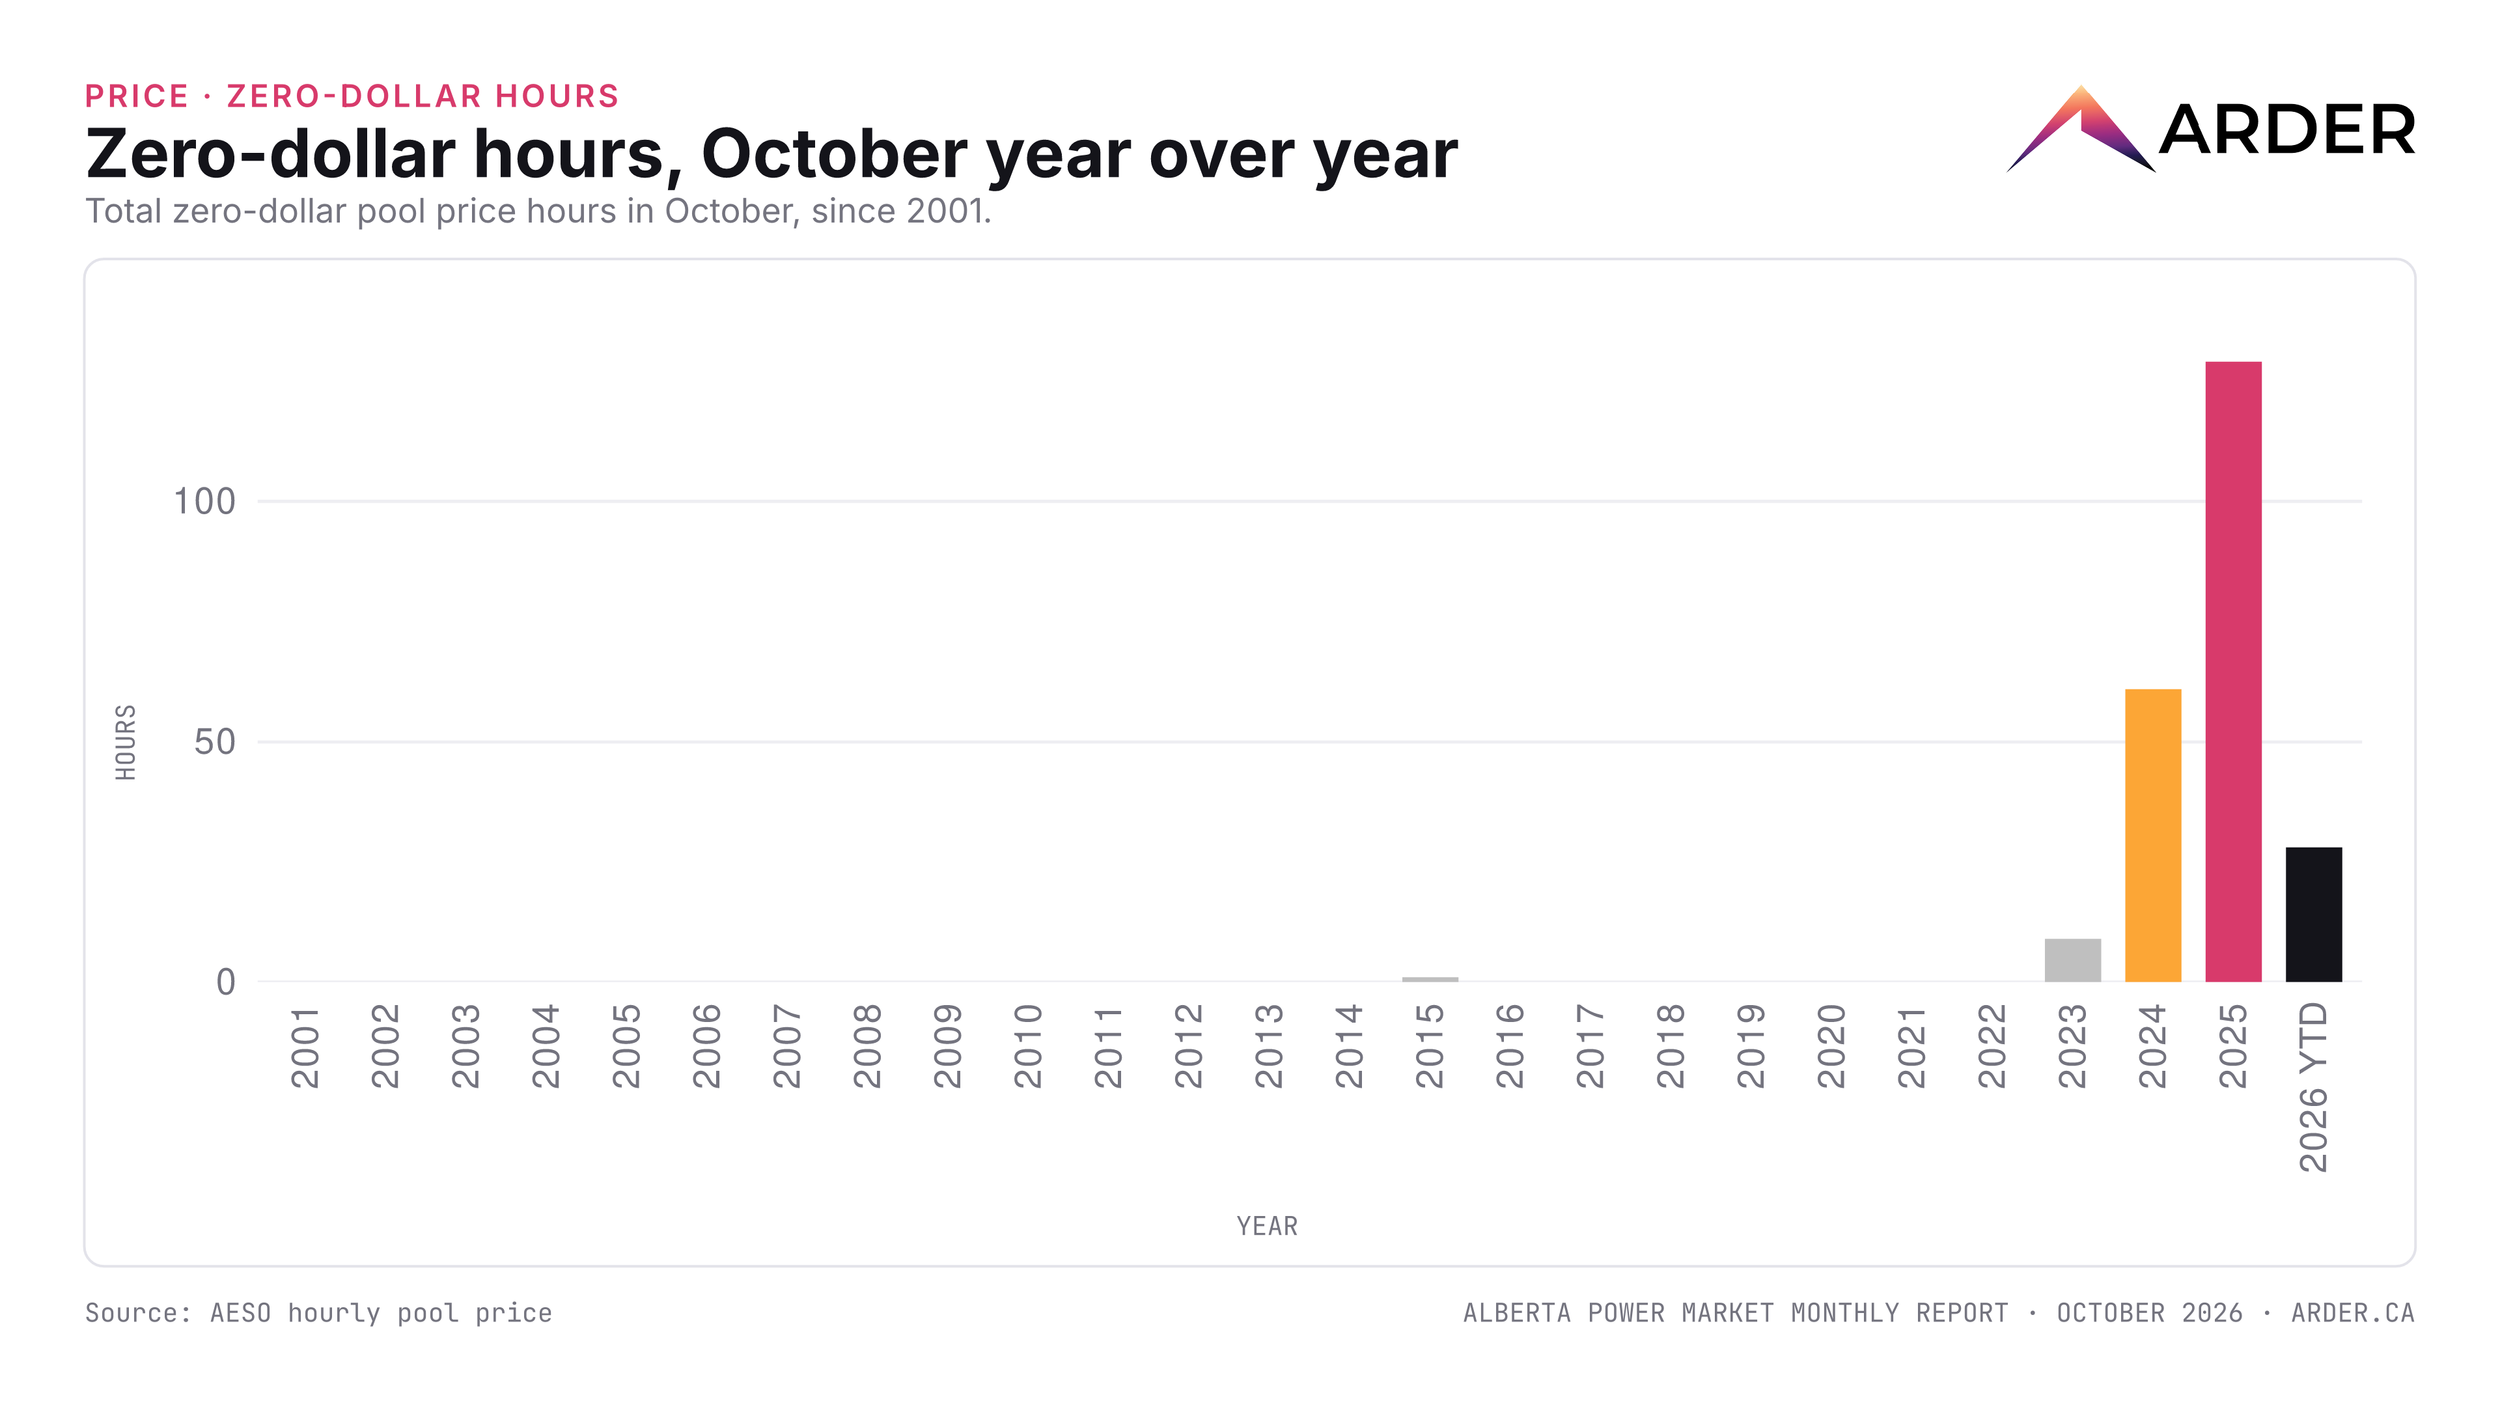
This means we did not quite reach the 1,000 zero-dollar mark for the year yet, instead standing at 856 for now. This remains equivalent to 11.7% of all hours for the year, which is still an all-time record.
What was different
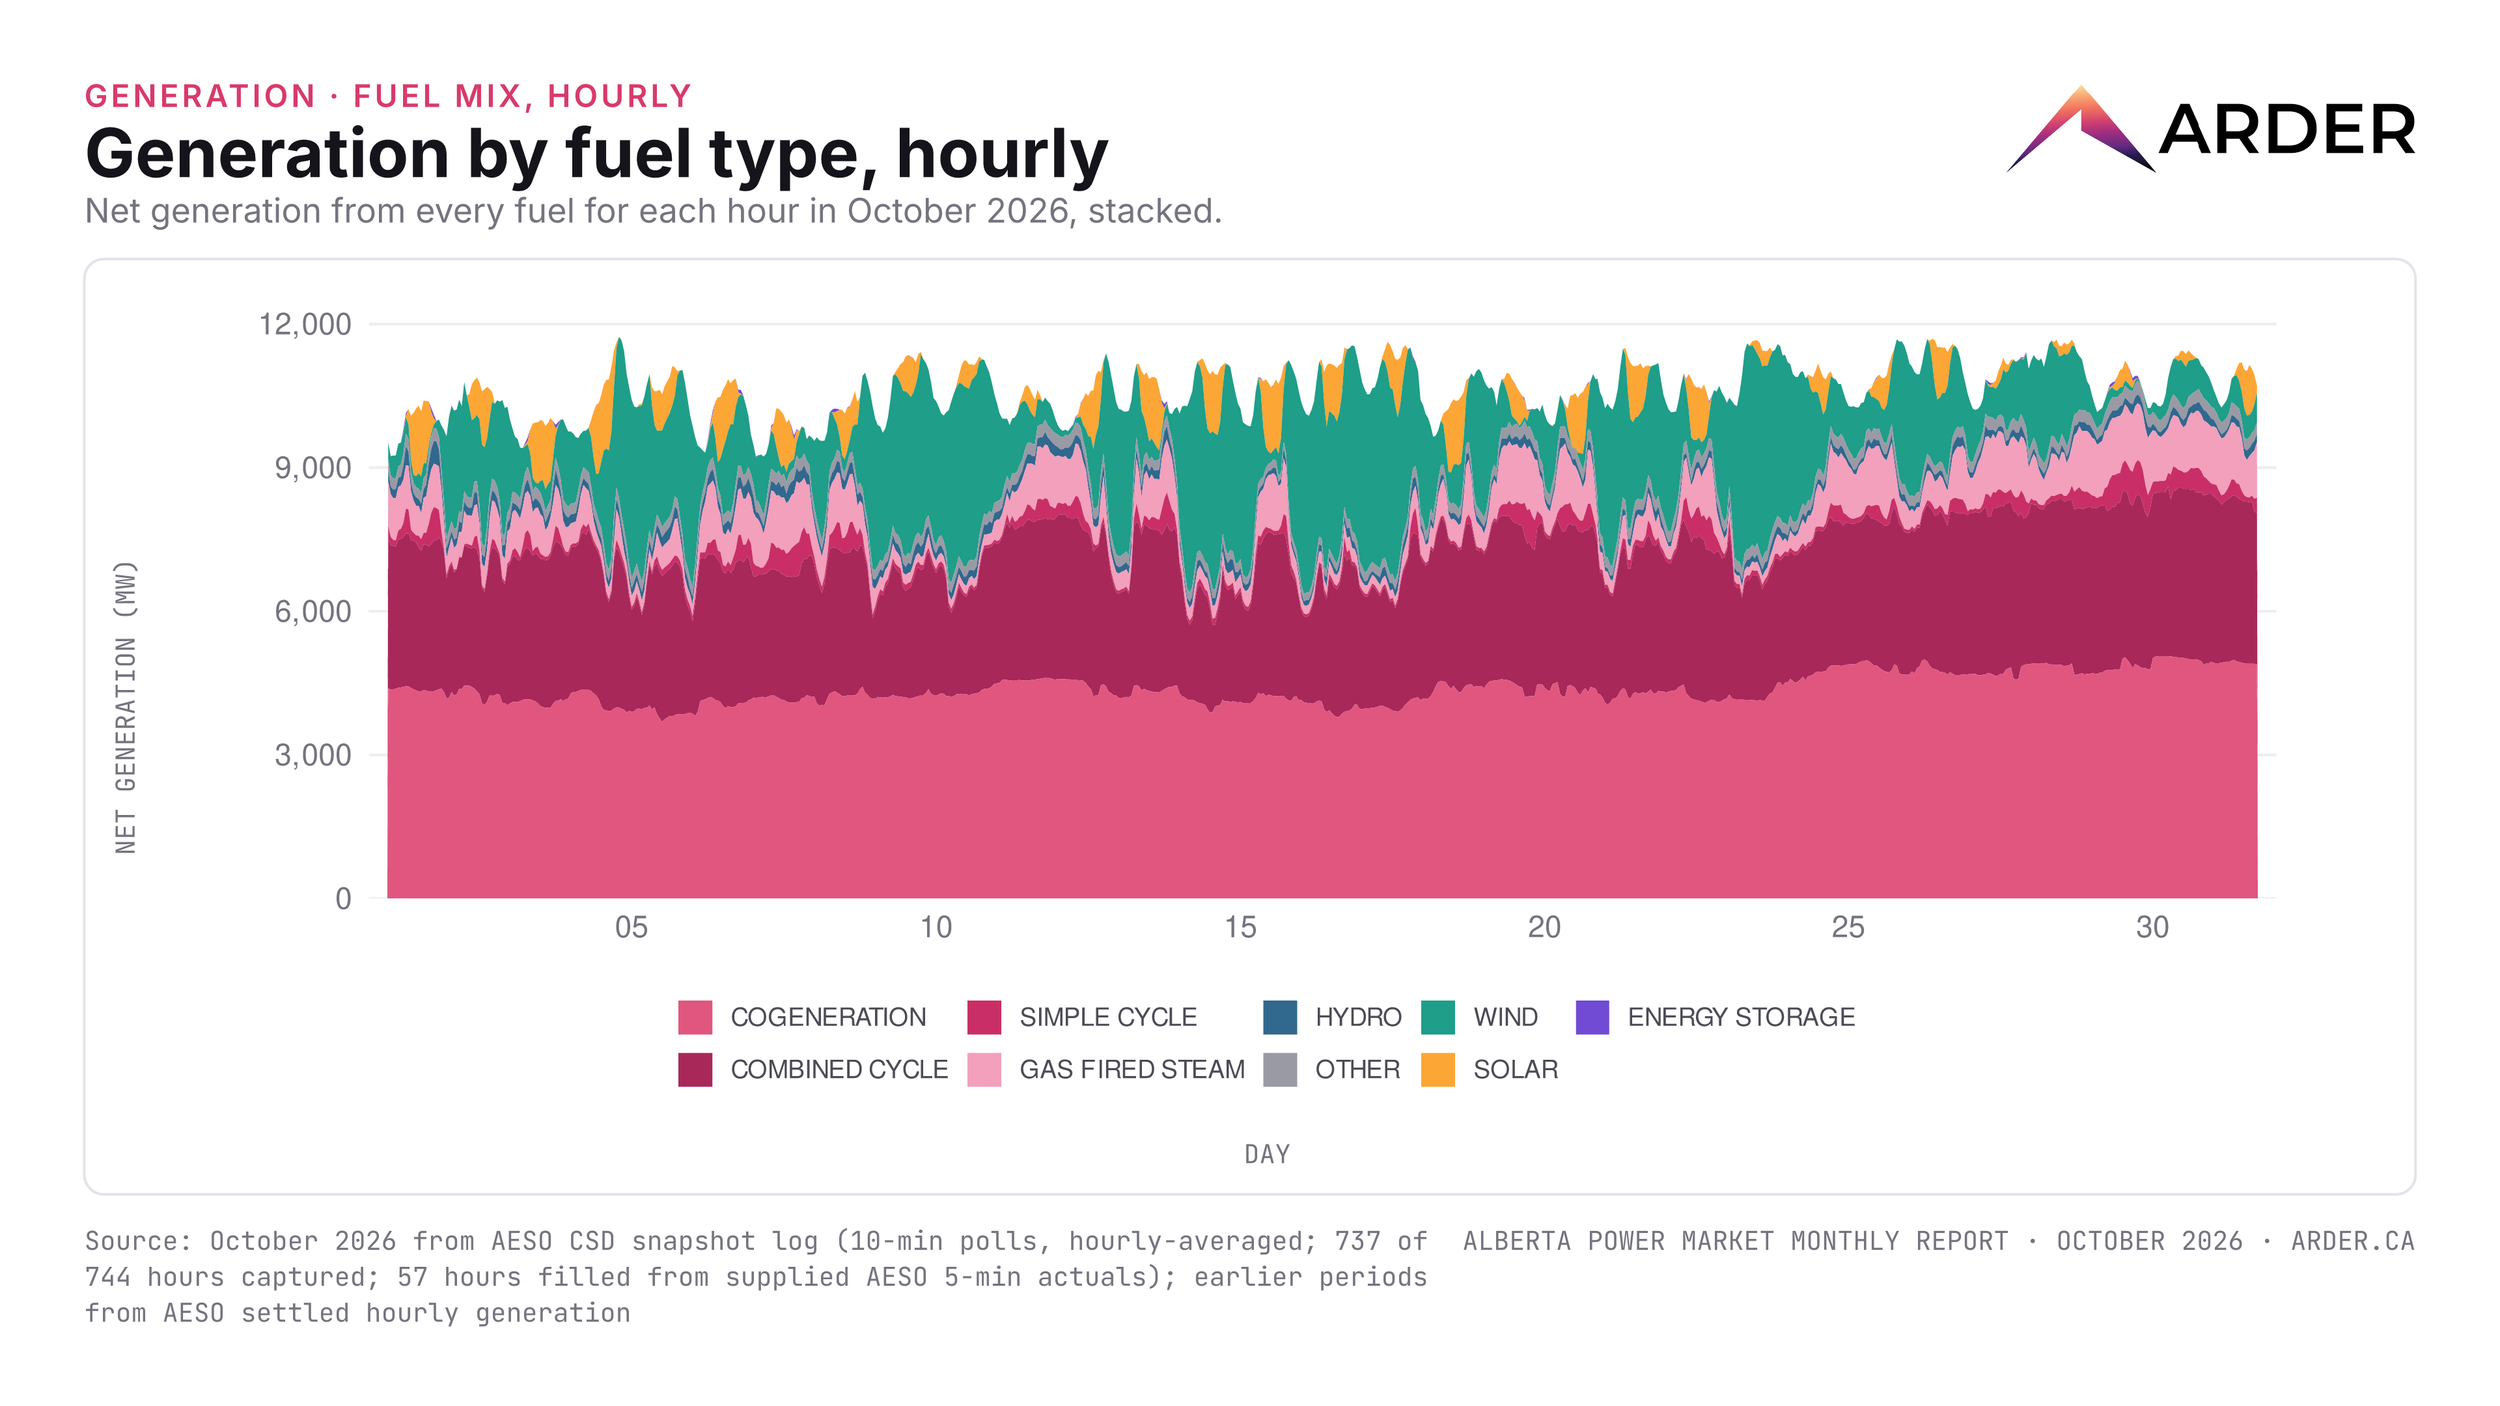
A big factor was intertie availability. Last year, intertie outages took away export capacity whenever there was significant wind power generation. This year, there were far fewer outages. Also, wind and solar generated less than last October, representing 16.4% and 2.7% of net generation respectively, vs. 19.3% and 3.2% last October, despite periods of high renewable power generation:
On top of that, load was significantly higher. Average Alberta Internal Load (AIL) was 10,470 MW this October compared to 10,087 MW last October, an increase of 3.8%:
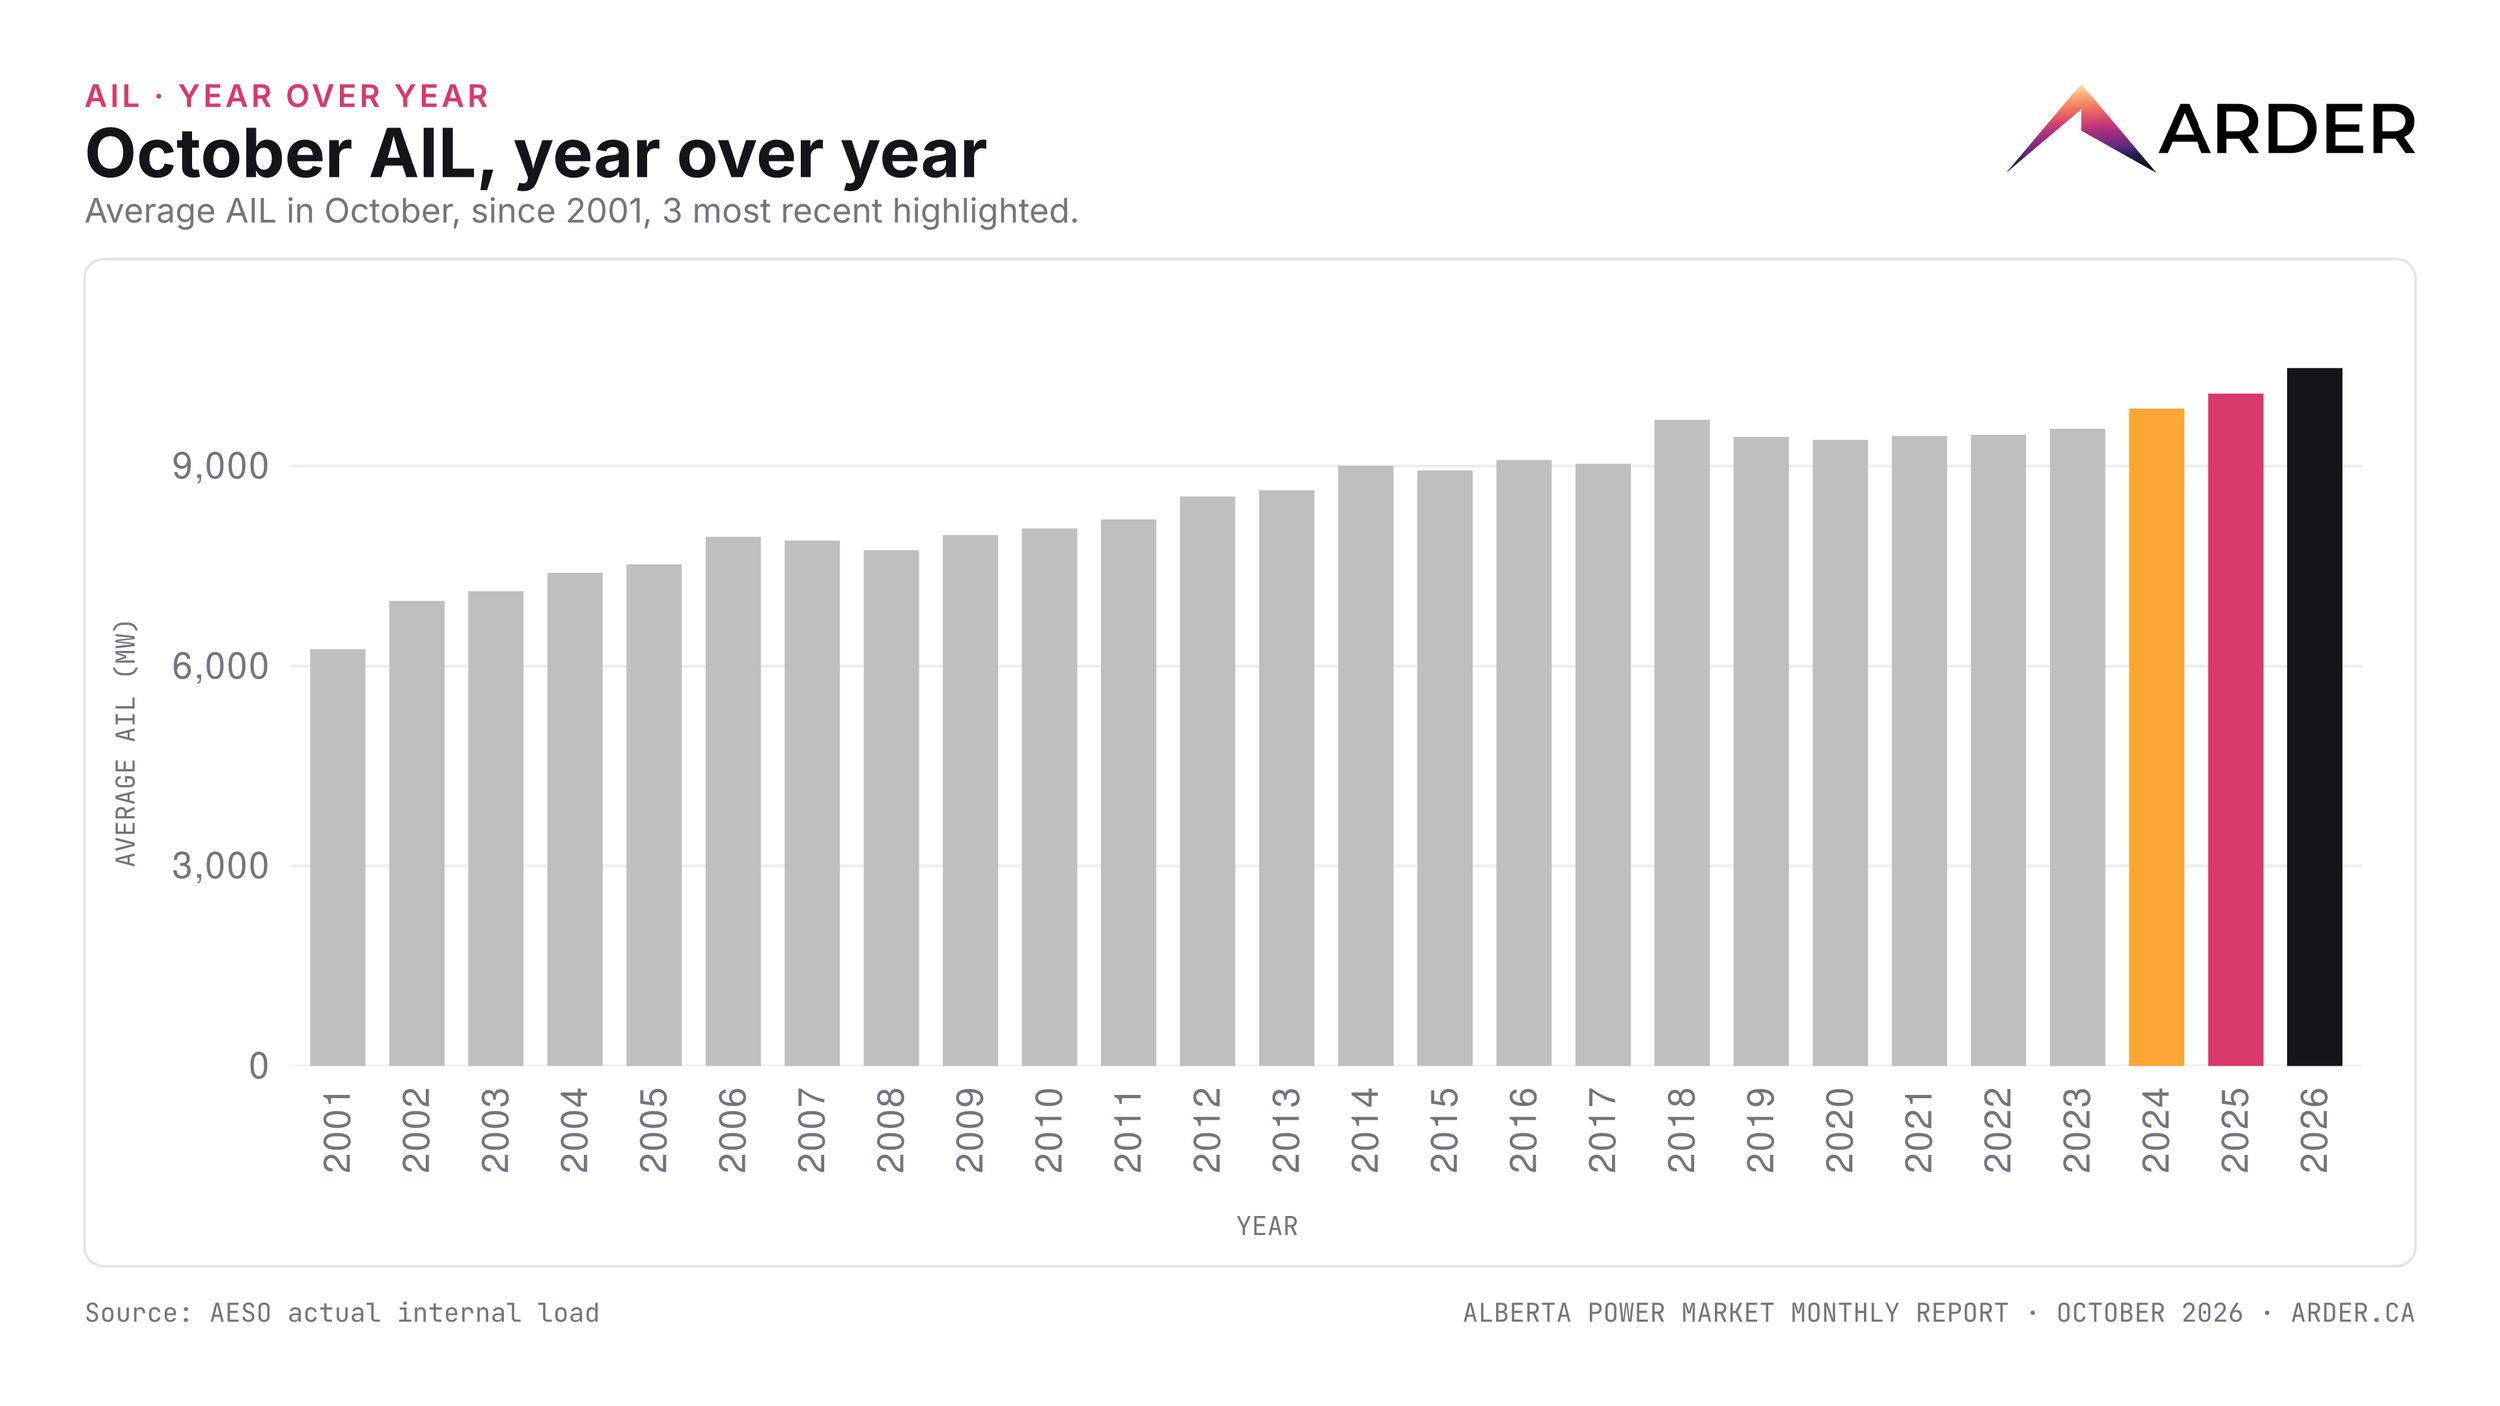
This compares to the long-term average growth of under 2% p.a. and year-to-date load growth of just under 3% p.a. In other words, demand was higher this October, and whenever the combination of our inflexible power generation (wind plus solar plus gas-fired cogen) exceeded AIL, there was generally export capacity available via the interties.
However, it is important to distinguish between broader market export capacity and local deliverability. Interties facilitate imports and exports for the Alberta market as a whole, whereas curtailments are typically the result of internal transmission constraints. Peak wind generation was highly concentrated around the middle of the month, which still led to significant curtailments during that period. This occurs when localized transmission infrastructure reaches its limits, effectively bottling up generation in specific areas—most commonly in the southeast of the province around Medicine Hat—even if the broader grid or interties could otherwise absorb the power.
What this means for loads
While a few factors made a like-for-like comparison difficult, like the much lower intertie maintenance, we may be nearing a low point in the overall price level, or may already have passed it. The 12-month average pool price at only CAD 36.44/MWh is barely sufficient to cover fuel cost and other Opex for most gas-fired generators, even with very low natural gas prices, let alone full-cycle cost including Capex.
And while we may have (more than) sufficient generation capacity available right now, load growth is real and accelerating. This includes data centers but also other industrial, commercial, and residential load growth and electrification, as discussed previously. Neighboring provinces and states are also increasingly short on power generation.
Current price levels are insufficient to support new build generation unless it is secured by associated large loads, like some of the data center projects, or unless we see significantly higher prices. We are seeing this in the forward market already, with forwards for the end of the decade approaching the CAD 100/MWh level. For loads, this means that the current low price level is transitory—and now may be a good time to start thinking about how to prepare for higher prices, including and beyond hedging. The good news is that industry has an increasing array of tools available to craft and implement robust power strategies.
Webinar — November 19th
If you are interested in exploring further what the trend toward (much) higher prices means for loads and what loads can do about it, join our free webinar on November 19th. The session is a compact 30 minutes with space for live Q&A.
We have opened up the platform: create your free account!
To help you stay ahead of fast-moving power developments, our core platform tier is now free. Sign up today to get:
Full Premium Dashboard Access: Interactive charts, historical trends, and live metrics.
Weekly Market Snapshots: Direct data delivery straight to your email every week.
Educational Resources: On-demand access to past webinars and more.