Alberta Power Market Snapshot: September 2026
Finally, a month that bucked some trends in Alberta's power market. September's average pool price was 60% below the value for last September, yet zero-dollar hours were only half as high. How does that fit together, and is this the first sign of a trend reversal? Here is our 5-minute take on what the September data is telling us.
(Note: Our long-term followers will notice upgraded and expanded graphics and statistics in this snapshot report. Our blog is now fed directly by our data platform and features graphs from reports available to our subscribers. We hope you find these upgrades useful and, as always, we are highly interested in your feedback!)
This article is for general informational purposes only and does not constitute financial, investment, or professional advice. Information is subject to change without notice and should not be relied upon for decision-making.
© 2026 Arder Energy™. All rights reserved. See Webpage Terms of Use.
The Price Environment
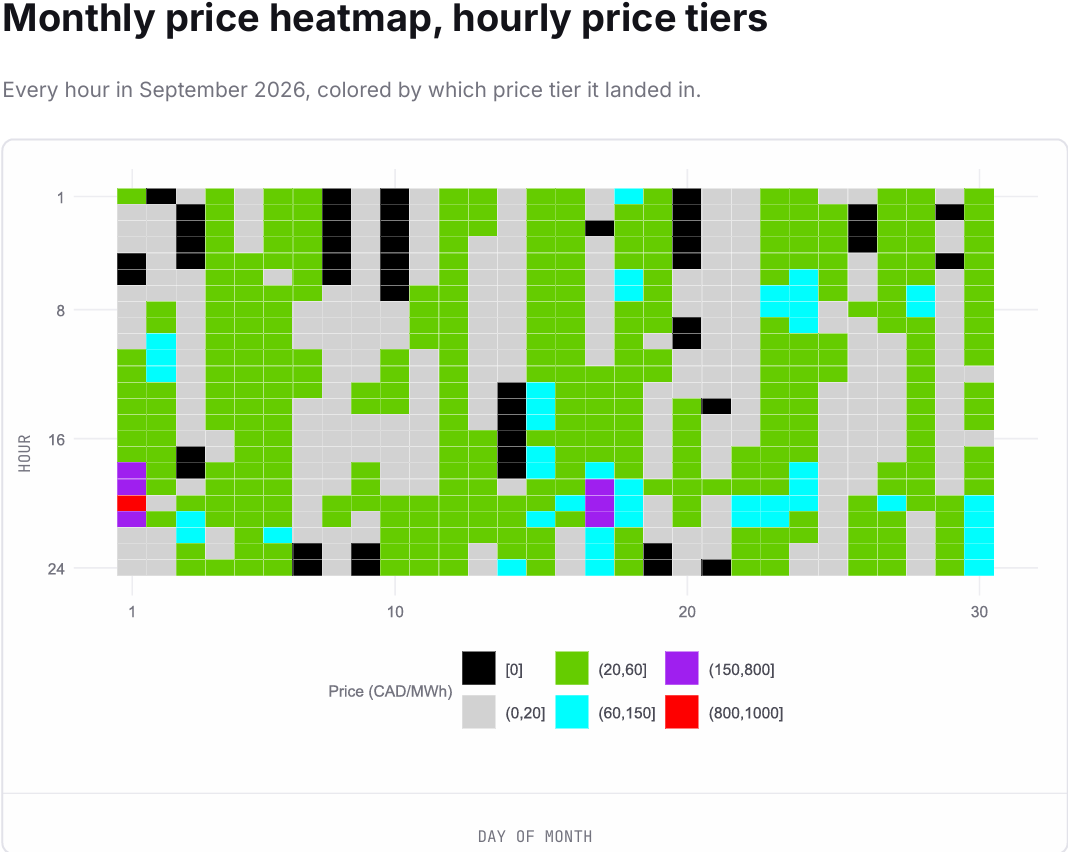
We will keep with the habit of starting with the price heat map, which immediately shows how "dull" this year's September was. It featured relatively few zero-dollar hours in black, and almost no price spikes in bright colors.
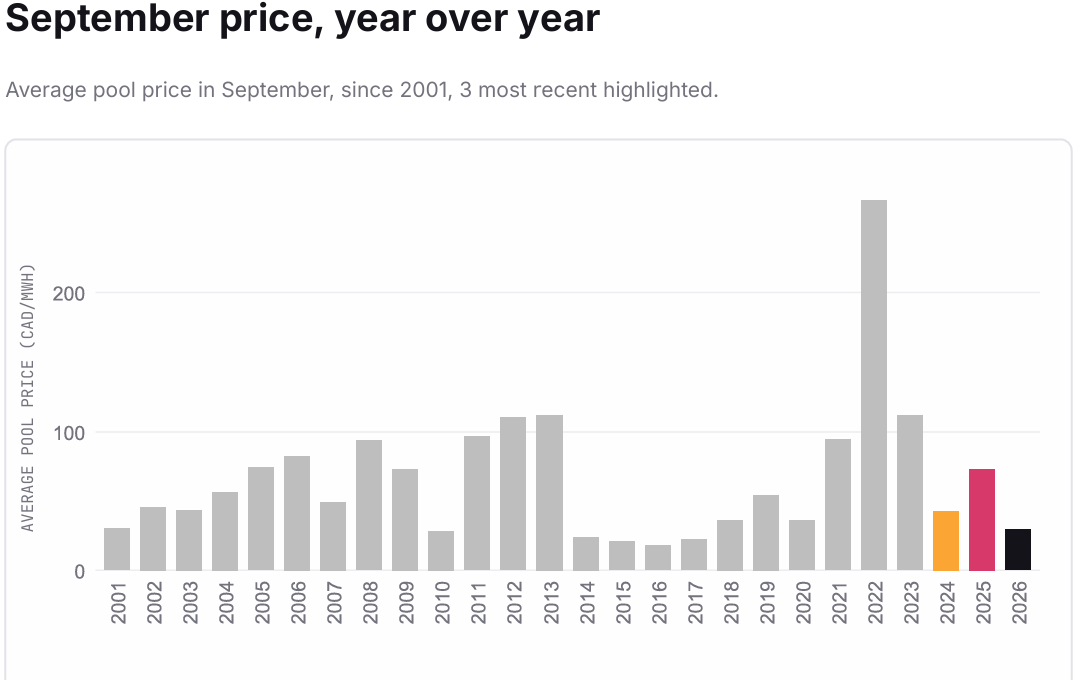
The average price settled at CAD 29.40/MWh, the lowest level for September since 2017.
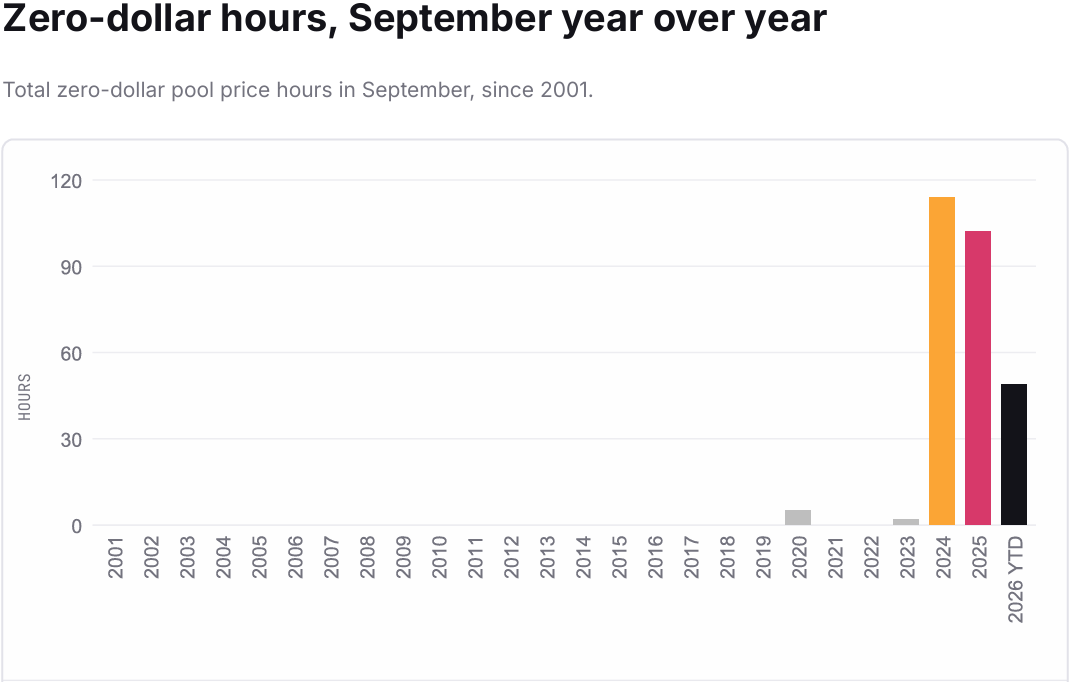
As the heat map shows, unlike many prior months, this low price level was NOT driven by a high volume of zero-dollar hours. Instead, we saw a large concentration of hours settling right around the average price. In fact, there were only 49 zero-dollar hours this September, compared to 102 during the same month in 2025, and 114 in 2024:
What Happened?
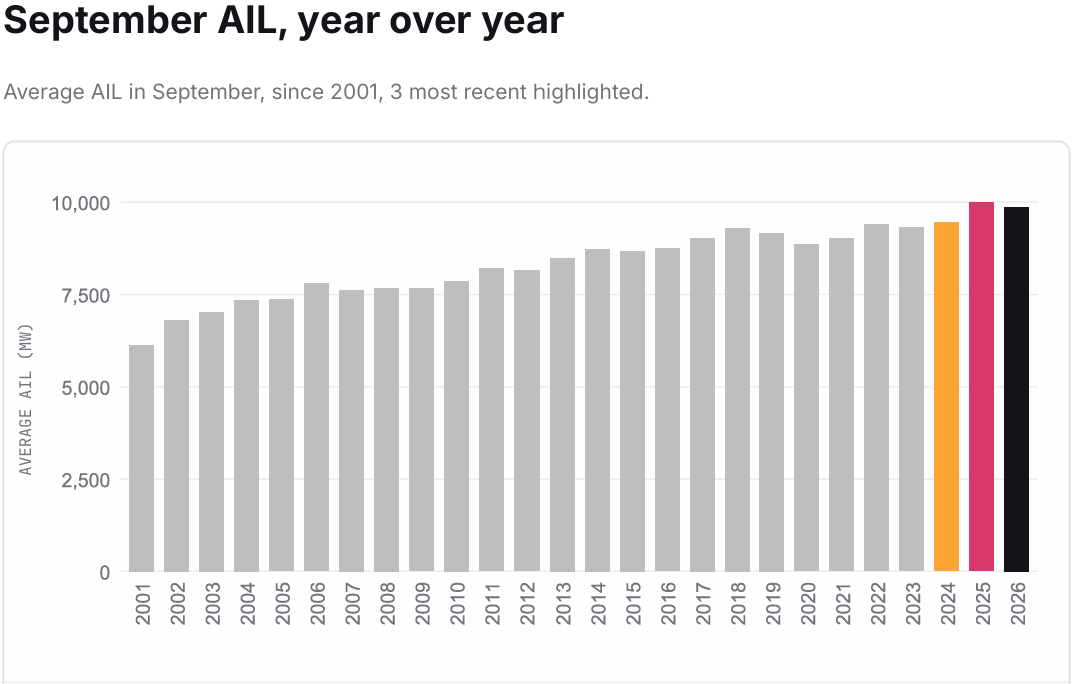
It wasn't load growth that kept the zero-dollar hours away. Average Monthly Alberta Internal Load (AIL) came in at 9,861 MW, 1.3% below last year's September average:
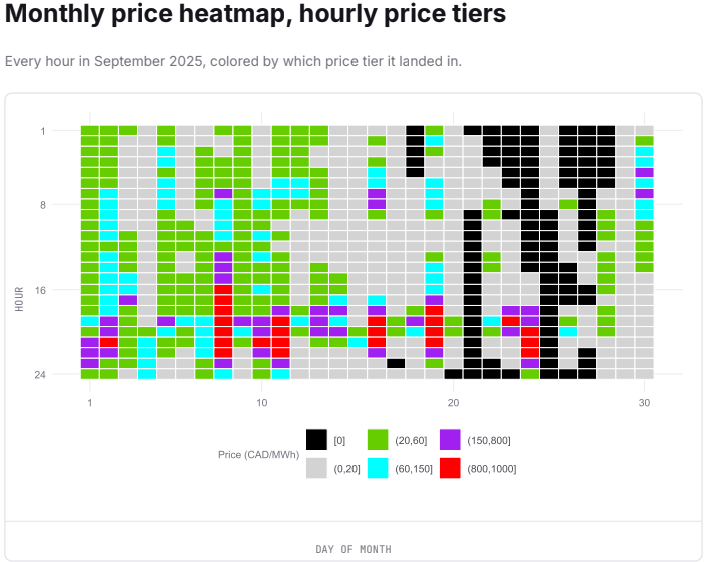
So, what was different in prior years? Looking at the price heat map from last September reveals an extreme concentration of zero-dollar hours in the second half of the month:
As the Market Surveillance Administrator's (MSA) Q3 2025 Wholesale Market Report outlined:
"In the back half of September, pool price volatility was increased as the BC/MATL intertie was taken offline for a planned outage from September 19 to 28. This outage meant exports were not available when intermittent generation in Alberta was high, and imports were not available when intermittent generation in Alberta was low. Consequently, pool prices on some days illustrated a bimodal distribution wherein prices were at the floor of $0/MWh for extended periods during the day before increasing above $900/MWh for a few hours during the net demand peak in the evening."
The AESO's Critical Outage Report shows there were no similar intertie outages this September. However, two periods of prolonged maintenance are coming up in October: tower replacements on the 5L52 line will lead to outages on the AB-BC Intertie from October 5-16 and October 19-30, taking away export capacity during a low-demand shoulder month.
Thus, while September may look like a "trend breaker" in isolation, we expect volatility and especially zero-dollar prices to reappear strongly in October.
The Bigger Picture
Zooming out to look at the cumulative number of intra-year zero-dollar hours for every year since market liberalization in 2001, we can see just how insignificant zero-dollar hours were until a few years ago—and how far above any prior year 2026 already is:
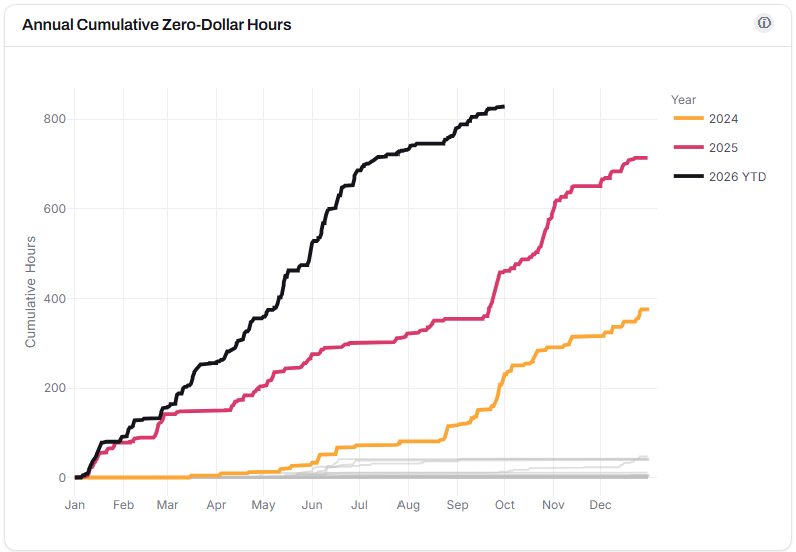
As of the end of September, we are at 828 zero-dollar hours for the year. In other words, wholesale power was “free” during 12.6% of all hours so far in 2026. It is quite likely that sometime in October, we will breach the 1,000-hour mark at the price floor for the year.
What Does This All Mean?
The value of flexibility keeps increasing, both for loads and for generators.
If you would like to explore flexibility opportunities for your company, please get in touch!
📊 ArderInsights Platform: From Market Metrics to Operational Strategy
Good strategies require good data. The ArderInsights Platform translates complex Alberta power metrics into operational realities, providing industry and investors with foundational market intelligence.
📈 1. Free & Premium Market Dashboards
Free Dashboard: Live tracking of Alberta Power Market pricing, zero-dollar hour frequency, and load dynamics.
Premium Dashboard: Advanced tracking of price, load and flexibility metrics, with optional private data integration.
📋 2. Regular Market Reports
Detailed monthly reports featuring price distributions, load flexibility, and TB2/TB4 arbitrage analytics, delivered promptly after month-end, available to Members through our platform.
🎓 3. On-Demand Training
Foundational capacity-building online training modules designed to establish a solid baseline across technical, commercial and regulatory power market aspects, available to Members through our platform.