
Alberta Power Snapshot - October 2024
[This article is not financial or investment advice, but provided for general information purposes only. All information is subject to change and should not be relied upon for any decision making. See Webpage Terms of Use.]
Our Q3 Alberta Power Market Update triggered several inquiries, mainly on whether the explosive growth in zero-dollar hours was some sort of fluke. Our view remains that it is most likely representing a fundamental regime change in the market. Here is a brief snapshot of what happened in October - more records have been broken!
Let the data speak for itself
The biggest story from Q3 remains the biggest story in October - the massive increase in zero-dollar hours. A simple chart tells the story:
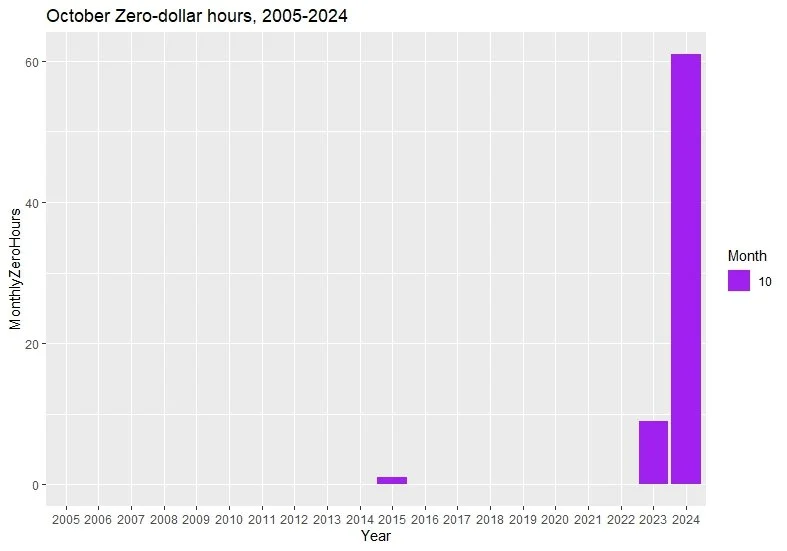
Zero-dollar hours in October, 2005-2024
Not a data error - there were indeed no zero-dollar hours in October in 17 out of 20 years from 2005-2024!
This is astonishing - only two years during the prior two decades saw any zero-dollar hours in October, and the maximum was 9 in 2023. This year - 61! That’s 8.2% of October’s total 744 hours.
But how were those zero-dollar hours spread - all within a few days? Do we have some very cheap followed by very expensive days? Not quite: cheap and expensive hours are quite evenly spread:
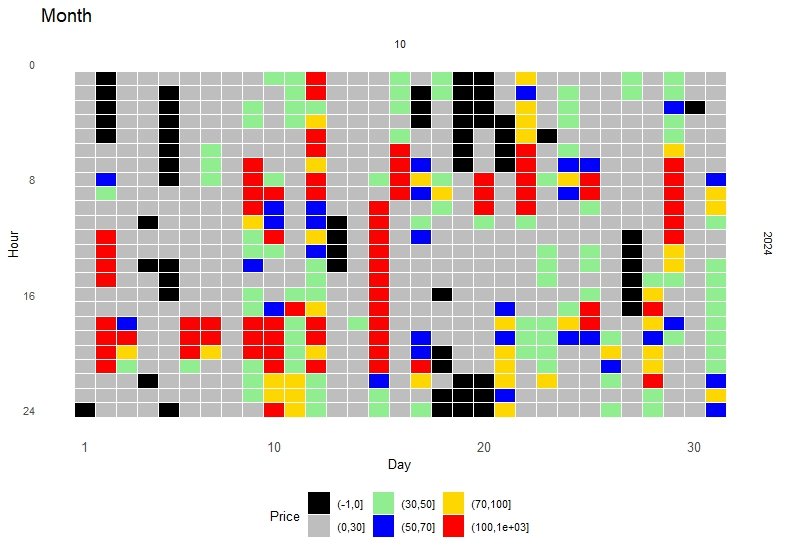
Heat Map of October 2024 hourly Alberta power pool prices.
Vertical axis: hour of the day, from hour 0 on top to hour 24 at the bottom.
Horizontal axis: day of the month, from 1st to 31st.
Colors: Hourly pool price, with each block representing one hour
black - “zero-dollar” (CAD 0/MWh);
grey - “ultra cheap” (CAD 0.01-30/MWh),
light blue - “cheap” (CAD 30-50/MWh),
dark blue - “normal” (CAD 50-70/MWh),
yellow - “expensive” (CAD 70-100/MWh),
red - “very expensive” (CAD 100+/MWh)
But note the price data for October 9th to 12th: - no zero-dollar, very few “ultra-cheap” and some “very expensive” hours. If you have a dispatchable load, like a heat battery, requiring up to 8 hours of charging per day, do these expensive days “destroy” the economics?
Rather than relying on intuition, let’s check the data by selecting the cheapest 8 hours per day and then averaging those cheapest 8 hours over the month. And to also get a better answer on our main question, whether we have a regime change in the power market, let’s compare this metric for October 2024 with the same metric for every October since 2005:

Daily lowest-cost 8 hours in October, 2005-2024 (CAD/MWh)
Prices are NOT inflation-adjusted - if they were, the 2024 record low level would be even more pronounced.
Another record - the average of the daily lowest-cost 8 hours was CAD 13.06/MWh, i.e. just over 1 cent per kWh. VERY cheap. And the lowest it’s been in October since at least 2005.
As we can see, the impact of the price “spikes” on lowest cost daily hours is minimal. And at CAD 47.74/MWh, even the average price of all hours during the month was rather low.
It indeed looks like a more “permanent” change rather than a temporary phenomenon, but we’ll follow up with more detailed statistics when the quarter (and year) are over.
In the meantime, if you would like to explore opportunities (or mitigate liability exposures from excess power production, e.g. from Cogen units) with thermal energy storage applications, we’d be happy to help - please get in touch!