Alberta Power: GROWTH!
Hardly a day passes without headlines about rising electricity demand, usually tied to the massive growth of AI data centers. The biggest takeaway? Demand growth is already exceeding even the most recent forecasts and impacting forward prices—and that’s before these data centers have been fully deployed.
The recommendation for large power consumers: Use the current window of calm to define and implement a robust and resilient power strategy. With what is coming down the line, waiting for the market to move first is a high-stakes gamble - here is why!
This article is for general informational purposes only and does not constitute financial, investment, or professional advice. Information is subject to change without notice and should not be relied upon for decision-making.
© 2026 Arder Energy™. All rights reserved. See Webpage Terms of Use.
Key Terms
Before we dive into the numbers, it is worth clarifying some key terms. We will be analyzing hourly averages of Alberta Internal Load (AIL), which represents the total electricity demand in the province. This includes power sourced from the grid—whether generated locally or imported—as well as on-site, 'behind-the-fence' (BTF) generation.
In Alberta, the portion of demand met by the grid is known as the system load, which accounts for approximately 70% of AIL. The remaining 30% is satisfied by BTF generation, primarily from large industrial cogeneration facilities that produce both power and process steam. We will focus on AIL for this analysis, as it provides the most complete picture of demand; any fluctuations in BTF generation & associated on-site demand are typically balanced by exports to or imports from the provincial grid.
Status Quo and Recent Forecasts
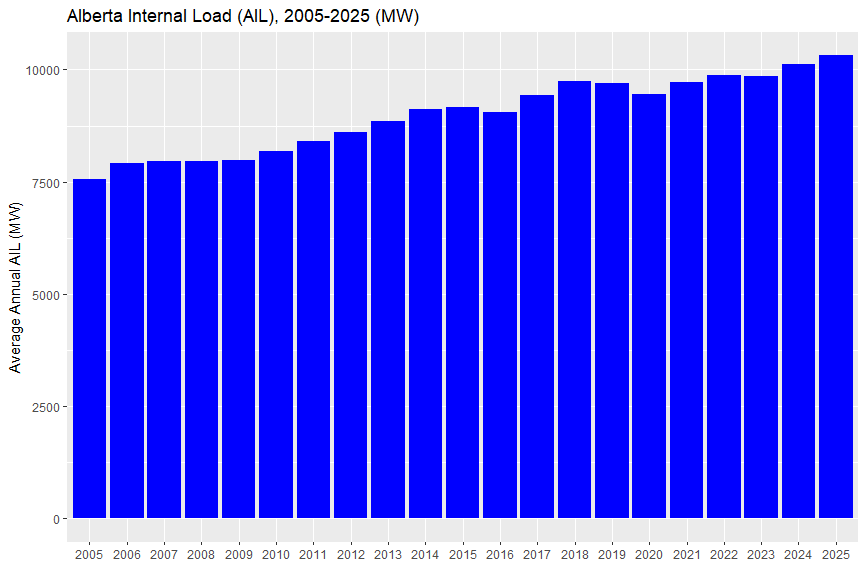
In 2025, AIL averaged 10,316 MW, with a minimum of 8,295 MW and a peak of 12,785 MW. This relatively tight range between minimum and maximum demand is owed to the high share of stable industrial power loads in the province.
In 2024, the Alberta Electric System Operator (AESO) issued its latest Long-Term Outlook (LTO), outlining two primary scenarios for load growth through 2043. The Reference Case projects average growth of 1.2% p.a. with peak demand reaching 16 GW, while the High Electrification Case forecasts 1.9% p.a. growth and a 20 GW peak. These 2024 figures already marked a significant shift from the 2021 LTO, which projected only 0.5% p.a. average growth.
The difference between 0.5% and 1.2% Compound Annual Growth Rate (CAGR) may not sound like much, but since it’s compounding, in one case the aggregate growth over 20 years is 10.5%, in the other case it’s 26%.
However, 2025 performance shows that actual demand is already outpacing these updated projections, with more growth expected. But first, a quick look back at the recent history of growth.
Trends
Over the past two decades, average AIL has grown from 7,565 MW in 2005 at a CAGR of just under 1.6% p.a.:
The graph below illustrates these annual growth trends in more detail. Note the sharp deceleration between 2007 and 2009, as demand stabilized following the commissioning of major oil sands projects in 2006 and the subsequent global financial crisis. Other notable dips include the 2015/16 contraction following the late-2014 oil price collapse, and the 2019 decline triggered by government-mandated production curtailments and record WCS price differentials. Finally, the chart captures the impact of COVID-19 in 2020, as well as the negative growth in 2023 resulting from an unusually mild winter and wildfire-related industrial disruptions.
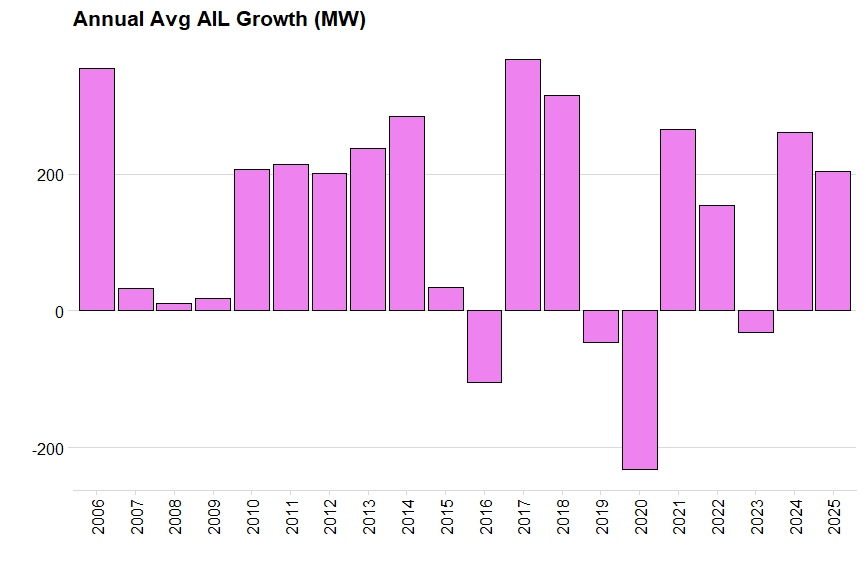
With a historic CAGR of 1.6% and 2025 AIL averaging 10,316 MW, we would typically expect approximately 160 MW of annual growth based on two decades of historical trends—aligning closely with the AESO’s 2024 LTO near-term projections of 120–190 MW.
While the actual 2025 growth of 204 MW may appear to be a minor outlier, the structural shift becomes clear when examining new allocations to data centers and the broader connection queue. The capacity already assigned to data centers for 2027 and 2028 is roughly six times the total system growth observed in 2025.
Effectively, we are facing six years of historical growth compressed into a single two-year window, layered on top of increasing 'normal' load. Furthermore, over 20 GW of additional large-load requests—about twice the size of current total demand—are now waiting in the interconnection queue.
Let’s illustrate the scale of this development visually:
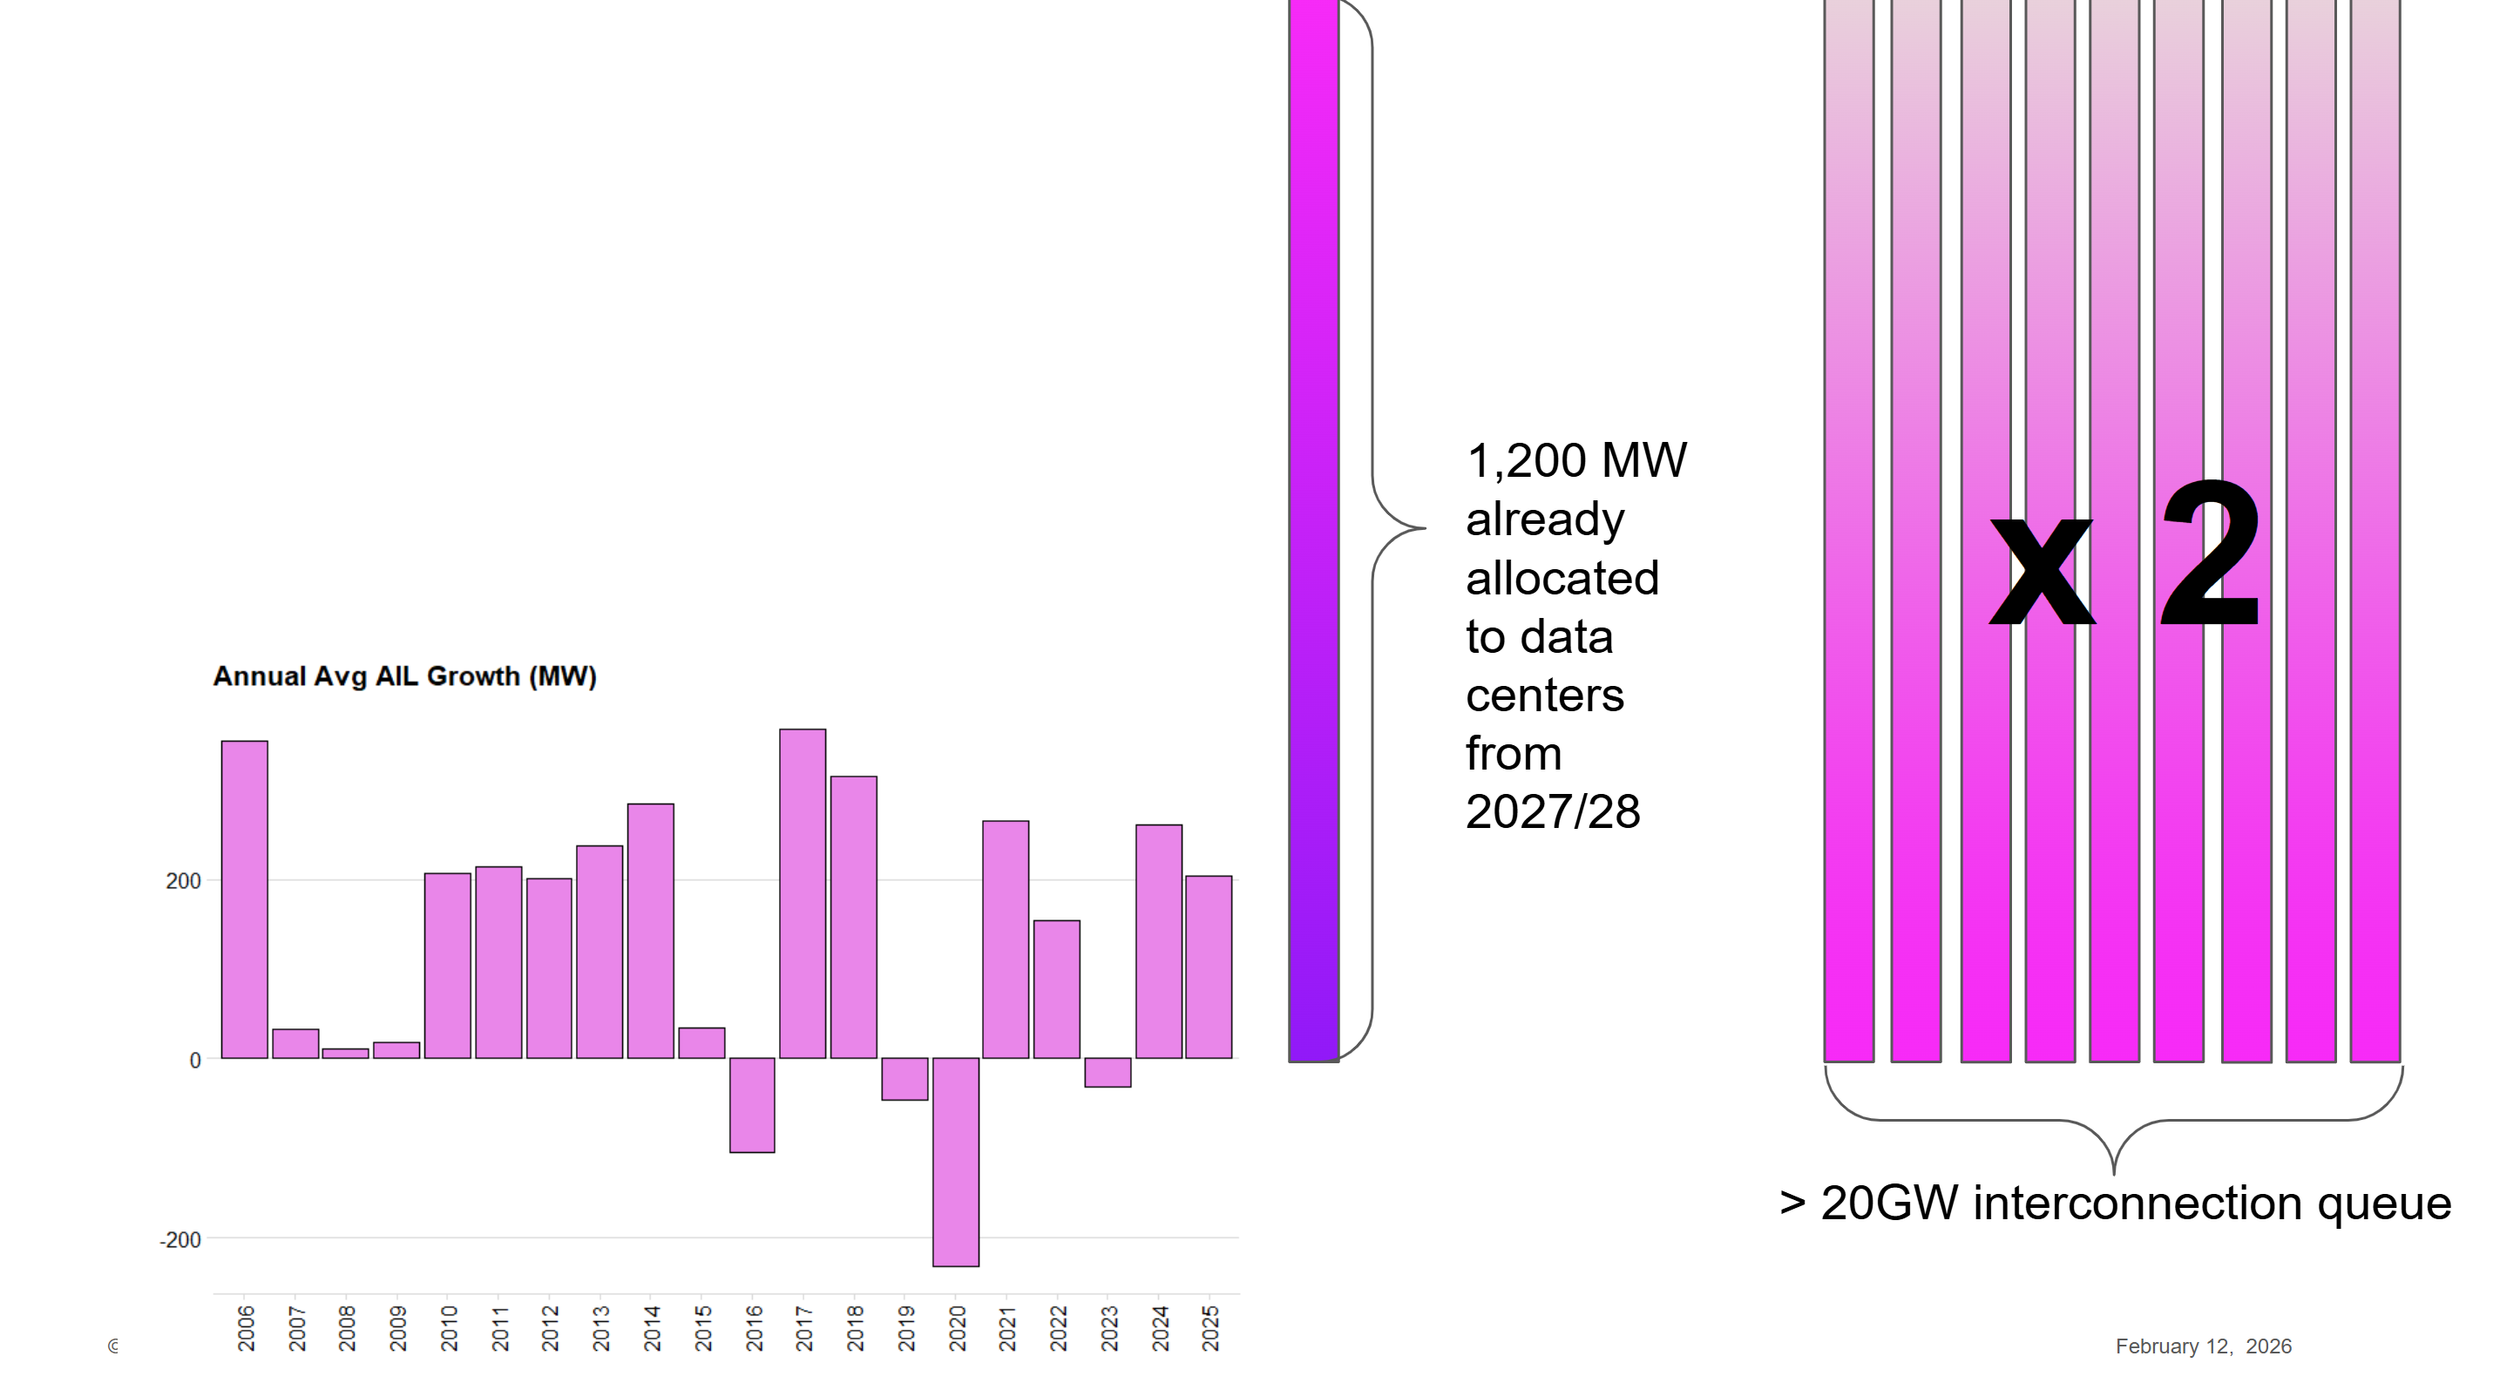
While it is unlikely that every project in the interconnection queue will be built, the impact of even the confirmed 1.2 GW allocation is BIG
To put it in perspective again: the AESO’s 2024 LTO Reference Case projects roughly 2.6 GW of total growth over the next twenty years, while the High Electrification Case forecasts approximately 4.4 GW. This single 1.2 GW data center allocation represents 46% of the Reference Case growth and 27% of the High Electrification growth forecast for the entire two-decade horizon—and it is arriving as an immediate layer on top of 'normal' and increasing load.
Price Impact
These developments are already shifting forward curves. The graph below, from Alberta’s Market Surveillance Administrator (MSA, Q3 Quarterly Report), illustrates the sharp price jump for the 2028 and 2029 calendar year forwards following the 1.2 GW allocation announcement in late Q2 2025:
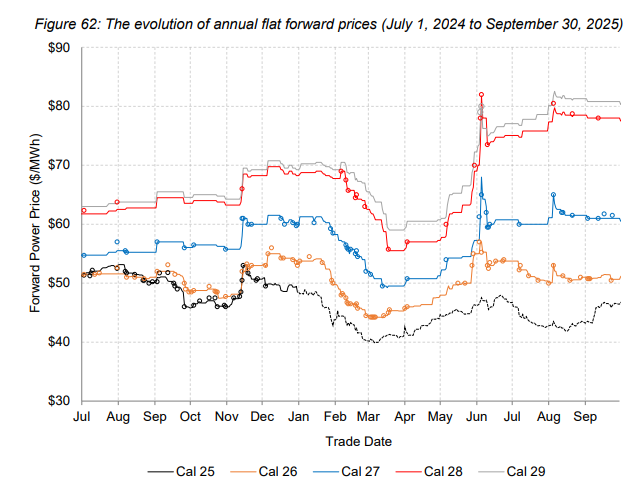
Currently, CY 2028 and 2029 are trading at or above CAD 80/MWh—nearly double the 2025 average pool price of CAD 43.68/MWh. While low liquidity means forward prices are far from perfect crystal balls, they represent the "skin in the game" reality of where market participants are establishing a new price equilibrium.
Conclusion and Implications
Rapid load growth represents a massive structural layering: rapid demand growth arriving alongside an expansion of non-dispatchable generation and inflexible cogeneration. We haven't even touched on the disruption from emerging technologies—batteries, for instance—which are already redefining market volatility.
Faced with this much uncertainty, what is the best path forward? We like to refer to Nat Bullard’s insight: 'No one knows anything.' (His annual energy presentation is essential reading—see slide 93 for the specific data on Texas load growth). In an environment where assigning probabilities to a single outcome is increasingly difficult, scenario planning is the only viable strategy. It allows a company to not only survive but thrive across a range of credible futures.
Ignoring this uncertainty is the riskiest path; it carries the implied assumption that the status quo will persist—an outcome that is becoming statistically improbable. For a deeper look at how to execute this type of analysis, see our earlier blog on the Deal Mapper Methodology (the framework applies as effectively to power agreements as it does to the LNG structures discussed).
Regardless of which scenario unfolds, the 'storm' is coming. Now is the time to batten down the hatches and implement a resilient electricity strategy.
Transforming Power into Competitive Advantage
The strength of Alberta’s power market lies in the agency it affords industrial participants. Through a combination of contractual, operational, and investment-based levers, organizations can transform power from a volatile cost center into a source of competitive advantage and resilience. If you are interested in exploring these strategies, please get in touch!
If you are looking for monthly updates, directly to your inbox, please sign up for our Newsletter!
And for those seeking a deeper dive into these market dynamics, our flagship course, Alberta Power Fundamentals, returns on October 22nd. The program features a small, peer-to-peer setting with a full day of in-person instruction preceded by online preparatory modules. Capacity is limited and we expect to sell out early again; early-bird registration is available until Stampede.