
Alberta Power: 2025 in Review
A Happy, Healthy, Joyful and Prosperous 2026 to our Clients, Partners, Supporters and Followers!
What better way to start the new year than looking back at the milestones of the last—and uncovering the clues they hold for 2026. We dive into price distributions, the frequency of zero-dollar hours, intra-day patterns, and seasonality, outlining what these trends mean for large industrial loads.
Here we go: our Alberta Power Market review of 2025!
This article is for general informational purposes only and does not constitute financial, investment, or professional advice. Information is subject to change without notice and should not be relied upon for decision-making.
© 2026 Arder Energy™. All rights reserved. See Webpage Terms of Use.
The Data
Before diving into the summary statistics, let’s start with a high-level view of how hourly pool prices in 2025 compared to the previous five years. There is no better tool for this than a heat map, which visualizes the "price bucket" for every single hour of the year.
We have applied the same price buckets introduced in our Alberta Power Market Snapshot: December & Q3 2025:
Black: zero dollar hour - “Excess Supply”: in most situations represents Excess Supply, and if the price floor was not at zero, this would likely be a negative-price hour (unchanged).
Light Grey: one cent to CAD 20/MWh - “Insufficient”: these ultra-low prices are mostly insufficient to cover even the variable cost of gas-fired power generation.
Green: CAD 20.01 - 60/MWh - “Marginal”: this price range reflects the marginal, “half cycle” cost of most gas-fired power generation.
Cyan: CAD 60.01 - 150/MWh - “Full-cycle”: prices in this range reflect the full-cycle, levelized life-cycle costs of most gas-fired power generation.
Purple: CAD 150.01 - 800/MWh - “Expensive”: Premium prices in excess of full-cycle costs for most power generation.
Red: CAD 800.01 - 999.99/MWh - “Peak”: Extremely high peak prices reflecting a very tight supply-demand balance.
While the exact "bookends" of these categories are open to debate, they provide a consistent framework for our analysis. If you have feedback or alternative suggestions for these thresholds, we would love to hear from you.
(Note: For those reading on a mobile device, the following chart is best viewed in landscape mode or on a larger screen.)
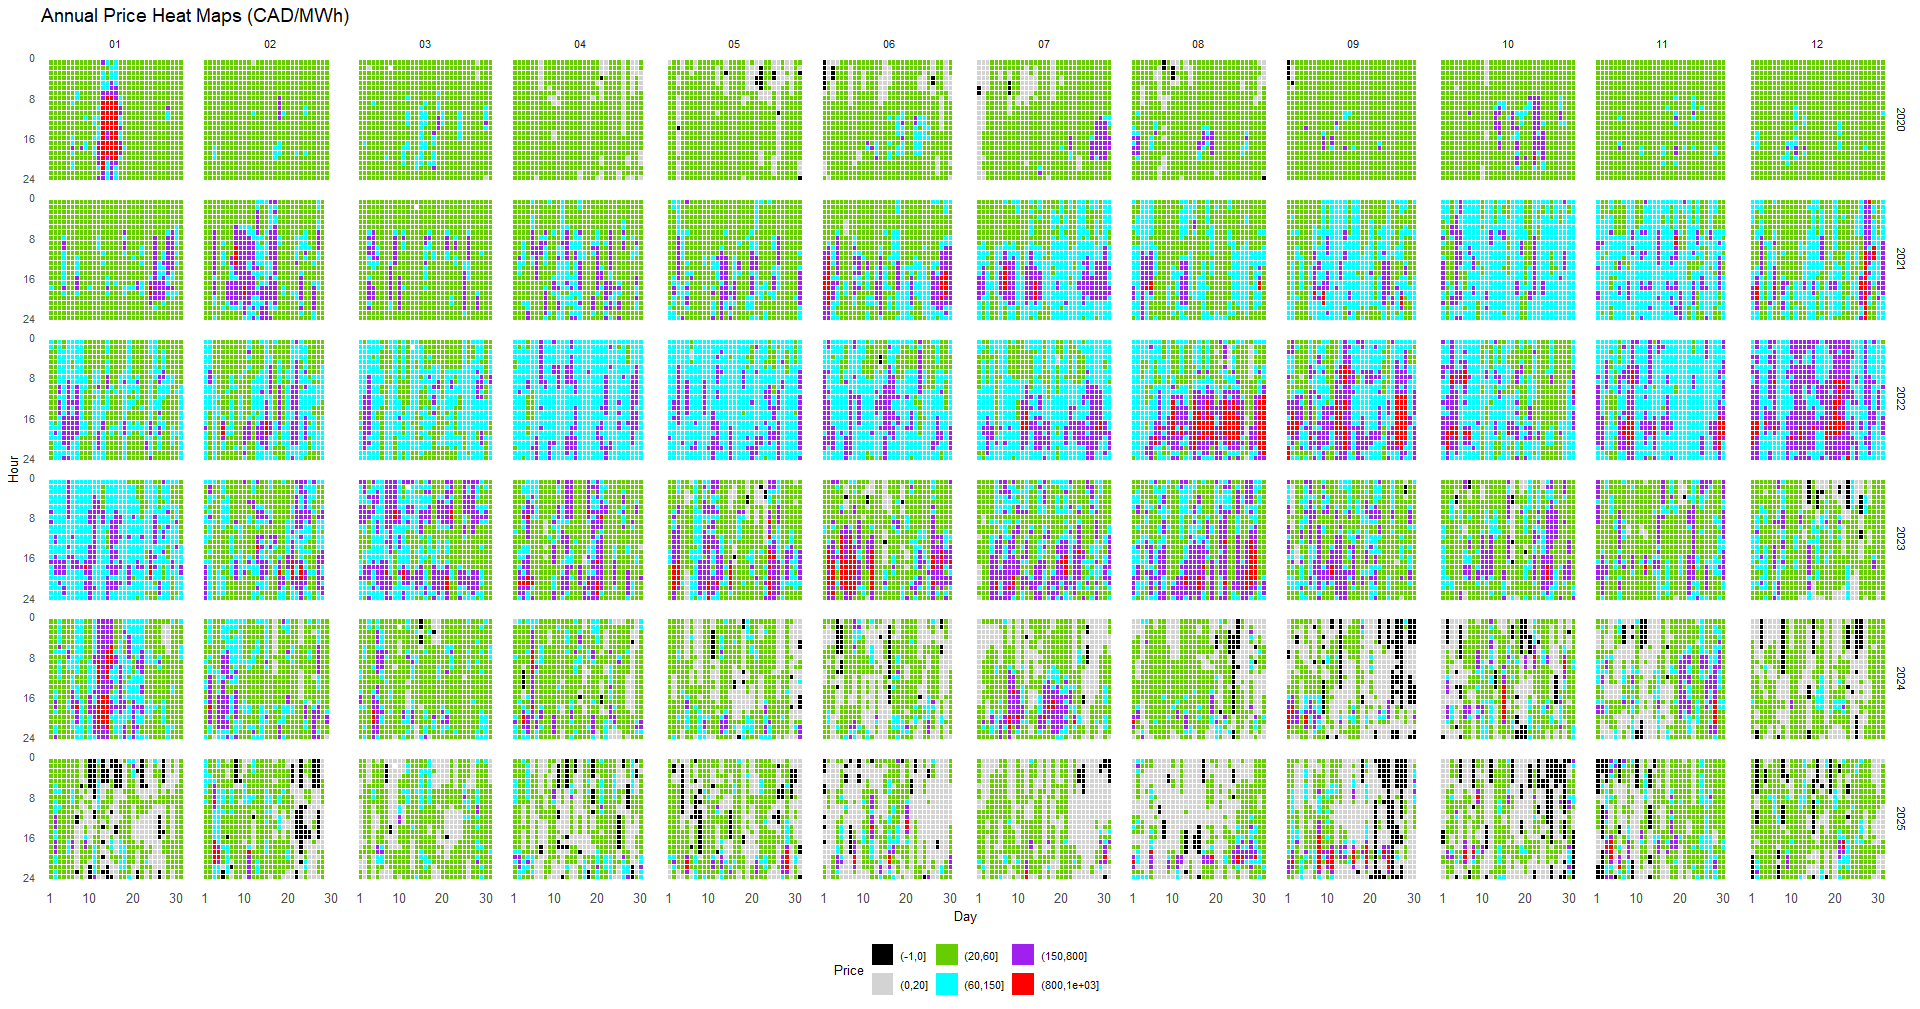
Alberta Power Market Price Heatmap, 2020-2025. Each main row represents one year, as marked on the right y-label. Each minor row represents one hour of day, starting from midnight on top to hour ending 24 at the bottom, as marked on the left y-label. The main columns represent the month of the year, as marked on the top x-label, and the minor rows the day of the month, as marked on the bottom x-label.
What we see is that every bucket is represented, though with far fewer high-priced hours (red and purple) than during the expensive years of 2021–23. There are also far more grey hours than in any previous year, signifying a significant increase in hours with ultra-low prices that often fail to cover even the marginal operating costs of gas-fired plants.
We also see very few light blue hours — 662, to be precise. As indicated earlier, these denote the price level required for most gas-fired plants to recover their full-cycle cost. In other words, during 92.4% of all hours, the hourly pool price was either higher or lower than this full-cycle ("LCOE") cost. This presents a challenge, but also an opportunity for flexible generation. As for the average price? We’ll get to that later.
Black is notably increasing. Though far from dominating, it represents the biggest story of the year: the rise of the zero-dollar hour. In 2025, 713 out of 8,760 hours were priced at zero CAD/MWh — that’s 8.1% of the time, an all-time record, and 90% higher than last year’s 376 hours. Just how remarkable this development is becomes clear when we compare the annual accumulation to every other year since 2005:
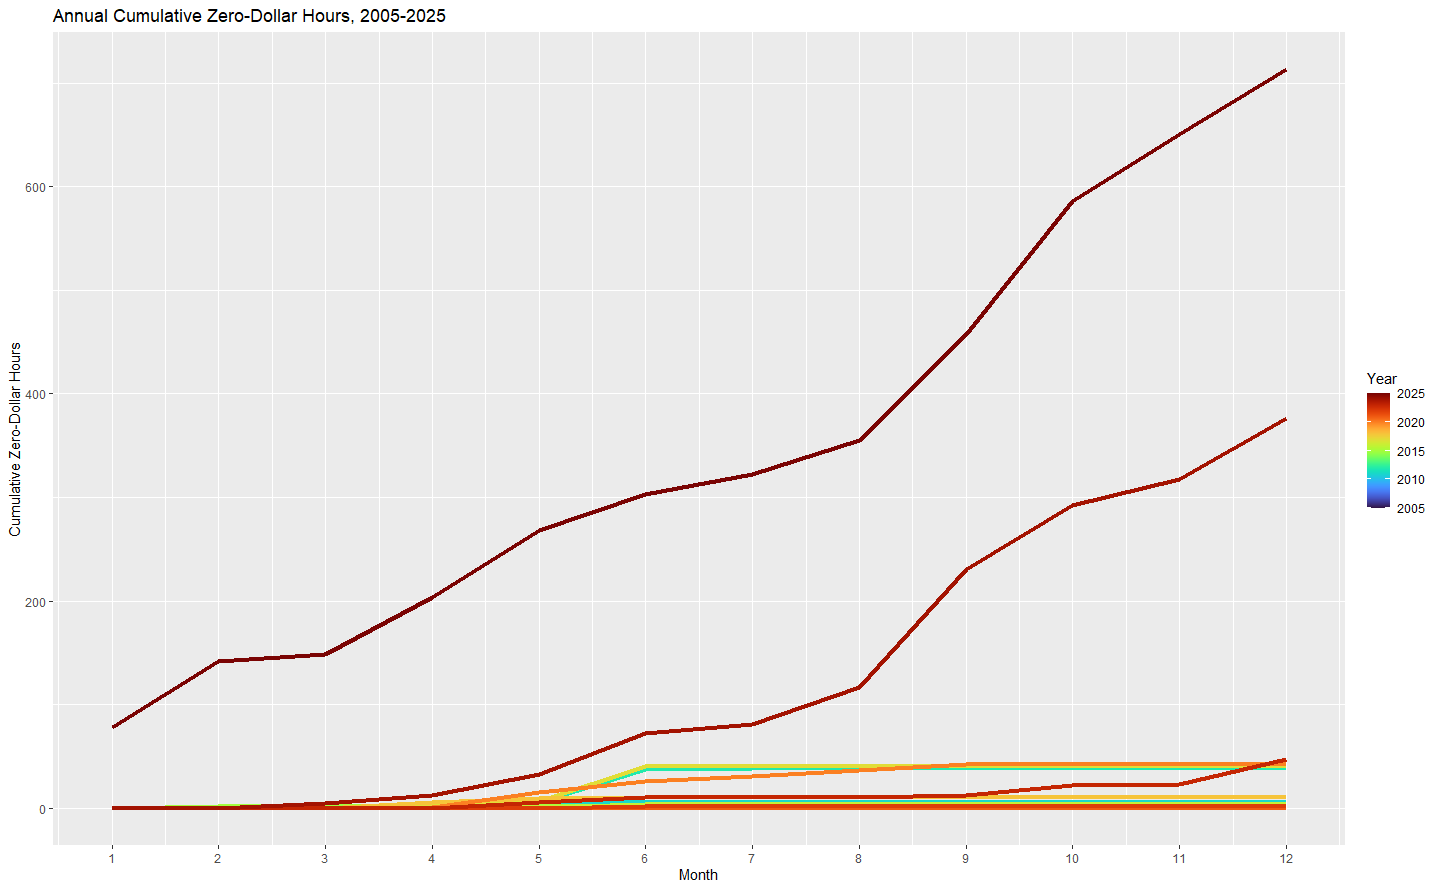
Cumulative annual zero-dollar hours in the Alberta Power Pool from 2005-2025
The key driver behind this development is the strong growth of inflexible power generation in Alberta. We are seeing a rising volume of inflexible gas-fired Cogen capacity alongside growing renewable generation, all while a lack of interties to neighboring provinces and states prevents the export of temporary Excess Supply. For more detail, see our 2024 Insights article, “The Change is Structural, not Cyclical”, which forecast this exact trend. Many of these zero-dollar hours would have been negatively priced if a price floor were not in place—and from 2032, this will likely be the case if the Restructured Energy Market (REM) design is implemented as currently planned.
Where do we go from here? We’ll explore this in more detail in our 2026 Alberta Power Market Outlook later this month, but in the meantime, here is a high-level perspective:
Suncor’s 800 MW Base Plant Cogen facility only reached peak production levels late in 2025, and hundreds of megawatts of additional solar and wind assets are set to come online in 2026. While demand is growing, the significant surge from data centers is not expected until after 2027—so be ready for another record year of zero-dollar hours in 2026.
Back to last year: The average pool price came in at CAD 43.68/MWh, the fourth-lowest level since 2005:
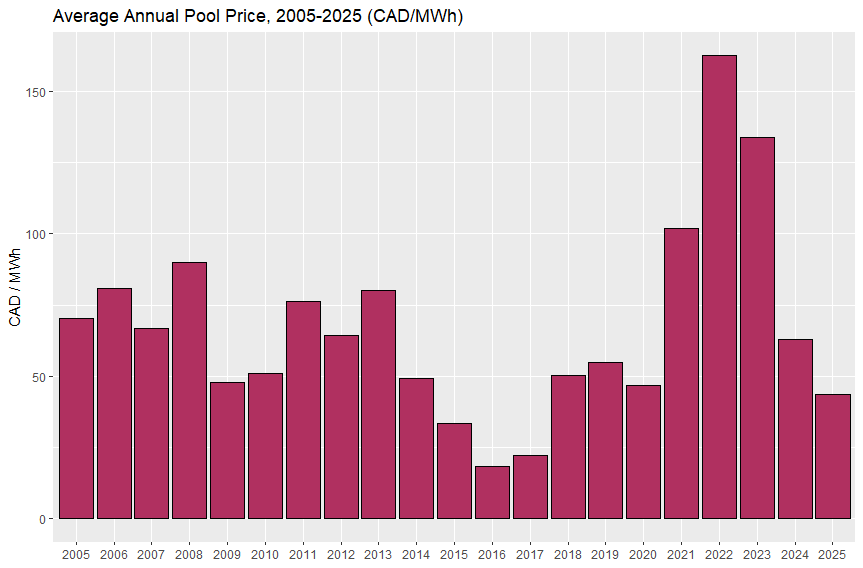
This is quite remarkable in itself, especially since these prices are not adjusted for inflation — we are very close to the bottom of historical average prices.
And once we look at our proxy for the prices available to flexible, dispatchable intermittent loads — the average price of the daily lowest-cost 8 hours — we see another record: at CAD 13.66/MWh, this is the lowest level since at least 2005:
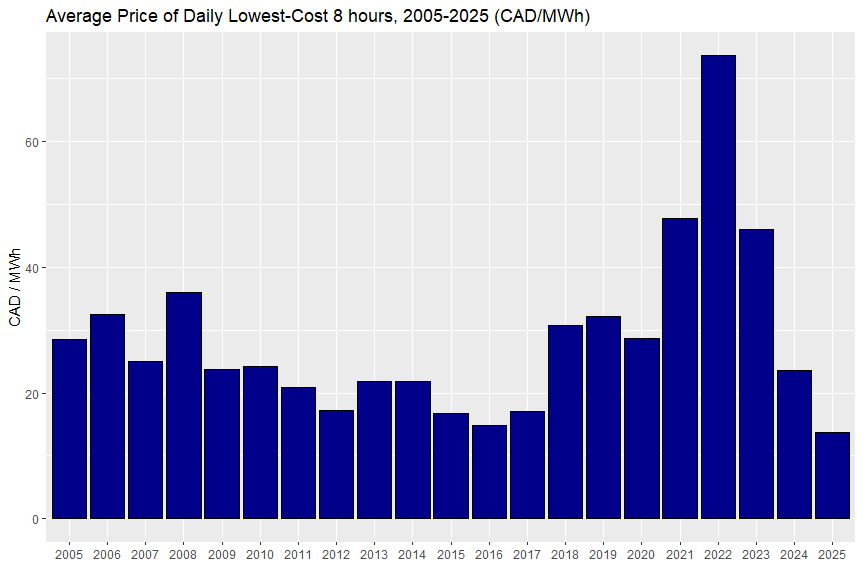
In other words, the energy price (excluding transmission and distribution) paid by those flexible loads would have averaged less than 1.4 Canadian cents per kWh. Remarkable.
Another interesting pattern becomes apparent once we look at the hourly distribution of prices throughout the year:
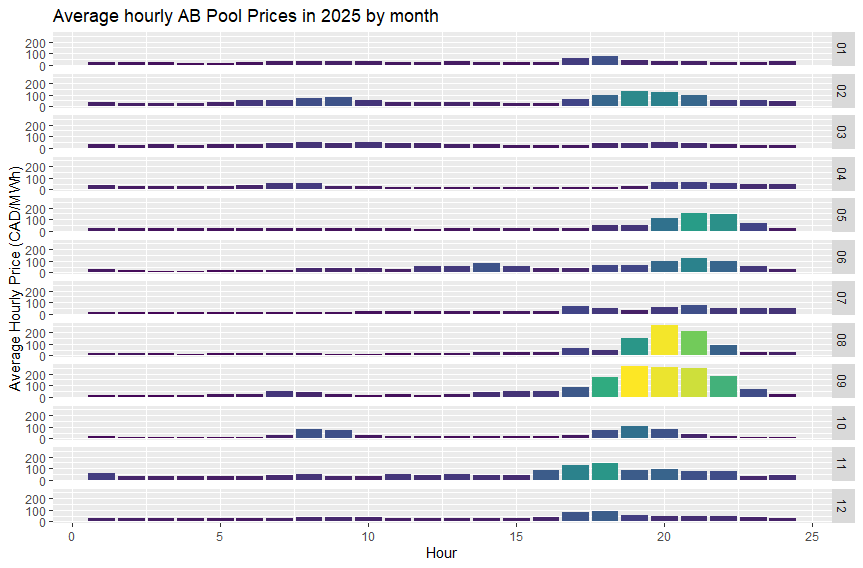
We see three particularly interesting aspects:
The pronounced concentration of high prices during the summer months
The absence of pronounced winter peak price hours
The strong concentration of peak prices during the evening ramp
We will go into more detail on each of these in upcoming Insights articles, but for now, there is one major takeaway for loads: with even just a small amount of flexibility, the most severe price spikes can be avoided.
And that’s a wrap for our high-level examination of 2025 statistics and their key implications. As usual, we are highly interested in your feedback and perspectives!
Next Steps
While broad market trends offer a baseline, true competitiveness and resilience are built on site-specific data. If you are ready to translate these insights into a tailored strategy for your facilities, please contact us for an opportunity screening. Our process is designed to be low-touch for your staff; we simply require the initial data to identify savings, at which point we take the lead on executing the strategy under your mandate to ensure your goals are met with minimal internal disruption. We are looking forward to working with you!
And if you are interested in learning more about the drivers of Alberta’s power market, consider joining our next training session on March 19th:

Alberta Power Fundamentals Training
Join us for a comprehensive one-day masterclass on the foundations of Alberta’s Electricity Market.
Tailored for:
Energy Executives seeking strategic market oversight.
Deal Leads managing complex energy transactions.
Legal & Financial Professionals supporting market-entry and deal flow.
At the end of the course, you will be able to:
Decode industrial power bills and identify cost-saving opportunities
Negotiate more effectively with your electricity provider
Prepare for the implications of Alberta’s power market restructuring in 2026
The number of seats is limited to maximize opportunities for interaction and discussion, and we expect a sold-out event - sign up now!