
Alberta Power Market Snapshot: December & Q3 2025
The new year is here, and we are wishing our Clients, Partners, Supporters and Followers a Happy, Healthy, Joyful and Prosperous 2026!
This year marks a turning point for Alberta’s power market. Between rapid technological evolution and far-reaching regulatory changes, we are seeing a 'stacked' structural shift that demands a new approach. Large consumers no longer have to be passive — Alberta’s liberalized market provides the agency to materially influence your costs, provided you are prepared.
We begin the year with a data-driven look back at December and Q4 2025. Our annual lookback, and our 2026 outlook, will follow over the next couple of weeks.
Let’s go!
This article is for general informational purposes only and does not constitute financial, investment, or professional advice. Information is subject to change without notice and should not be relied upon for decision-making.
© 2026 Arder Energy™. All rights reserved. See Webpage Terms of Use.
The Data
We begin this month’s review with our updated price heatmap. In response to reader feedback, we have streamlined our price categories into more intuitive, market-relevant ranges to better highlight significant hourly pool price trends.
Black: zero dollar hour - “Excess Supply”: in most situations represents Excess Supply, and if the price floor was not at zero, this would likely be a negative-price hour (unchanged).
Light Grey: one cent to CAD 20/MWh - “Insufficient”: these ultra-low prices are mostly insufficient to cover even the variable cost of gas-fired power generation.
Green: CAD 20.01 - 60/MWh - “Marginal”: this price range reflects the marginal, “half cycle” cost of most gas-fired power generation.
Cyan: CAD 60.01 - 150/MWh - “Full-cycle”: prices in this range reflect the full-cycle, levelized life-cycle costs of most gas-fired power generation.
Purple: CAD 150.01 - 800/MWh - “Expensive”: Premium prices in excess of full-cycle costs for most power generation.
Red: CAD 800.01 - 999.99/MWh - “Peak”: Extremely high peak prices reflecting a very tight supply-demand balance.
Why the emphasis on gas-fired generation in these buckets? As the dominant force in Alberta’s supply stack, (non-Cogen) gas remains the marginal price-setter outside of zero-dollar hours. Given our limited intertie capacity and nascent storage levels, gas-fired assets are currently the only resource capable of ensuring 24/7 reliability and meeting the province's firm demand.
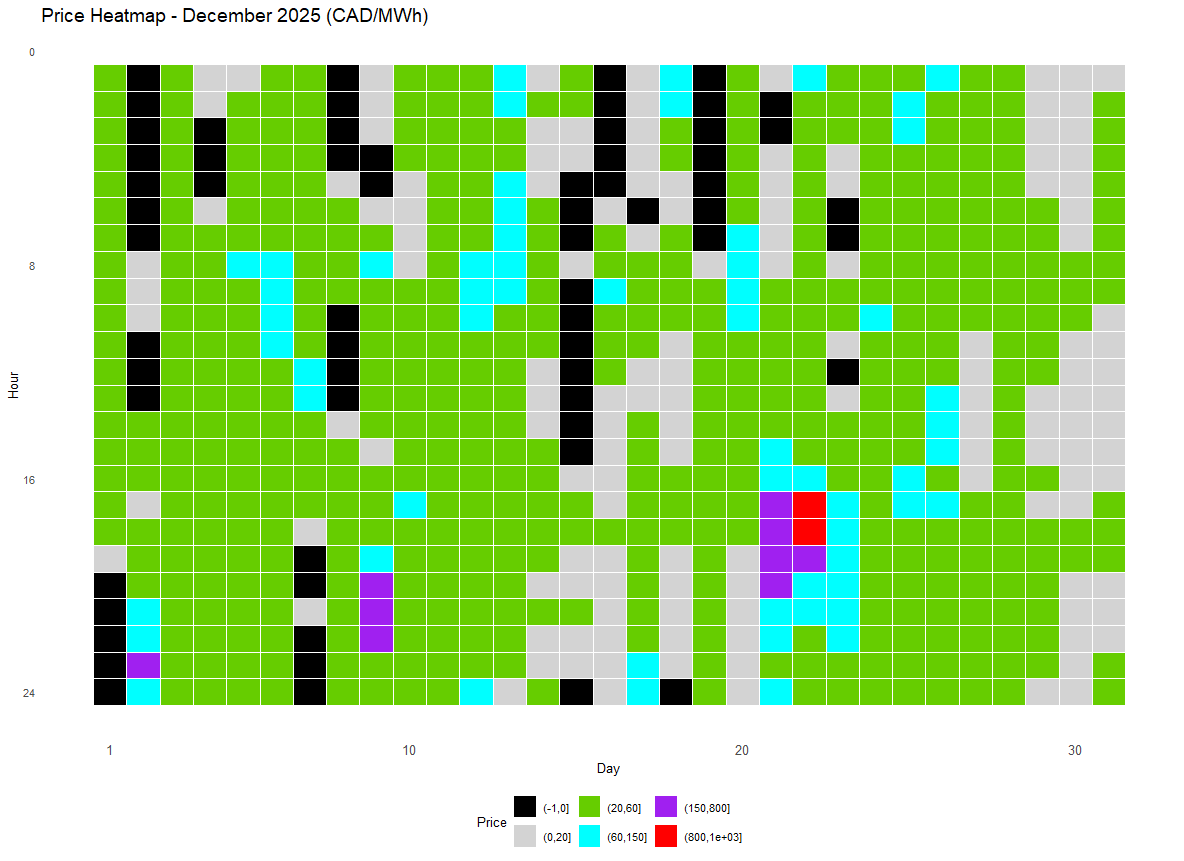
Heat Map of December 2025 hourly Alberta power pool prices
Black: zero dollar hour - “Excess Supply”
Light Grey: CAD 0.01 - 20/MWh - “Insufficient”
Green: CAD 20.01 - 60/MWh - “Marginal”
Cyan: CAD 60.01 - 150/MWh - “Full-cycle”
Purple: CAD 150.01 - 800/MWh - “Expensive”
Red: CAD 800.01 - 999.99/MWh - “Peak”
While the majority of hours saw prices sufficient to cover marginal operating costs (Green), they remained below the threshold for full-cycle cost recovery. The second-largest category comprised hours where prices failed to cover even the basic variable costs for most dispatchable generators (Black/Grey). Of the month’s 744 hours, only 58 reached the 'Full-cycle' level (Cyan) required to support the long-term levelized cost of gas-fired assets. This means that for over 90% of the month, prices deviated significantly from the sustainable average required for these generators. With only nine hours in the 'Expensive' and two in the 'Peak' brackets, the market exhibited a strong downward asymmetry.
The monthly average pool price settled at CAD 39/MWh—the 7th-lowest since 2005, and significantly below the long-term median.
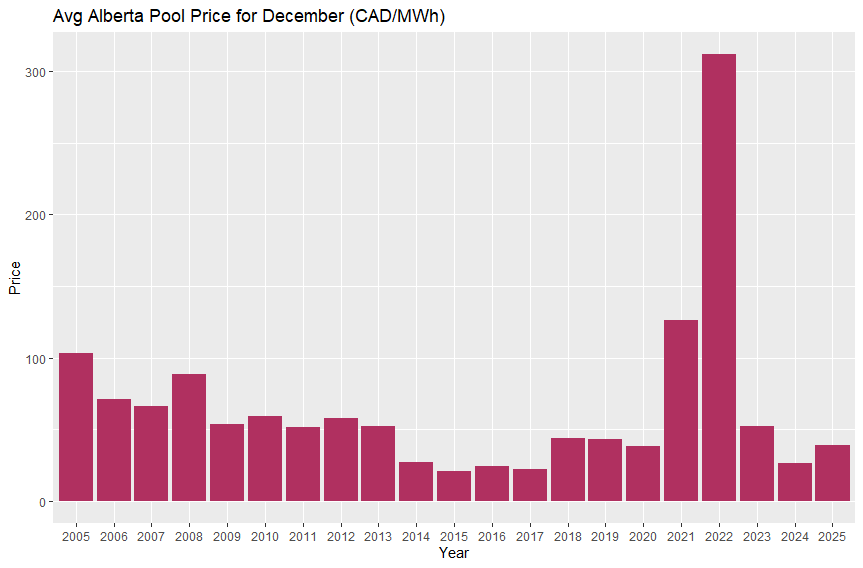
December average Alberta electricity pool prices, 2005-2025 (CAD/MWh)
Prices are not inflation-adjusted
At this level, gas-fired units with limited dispatchability (including most of Alberta’s Cogeneration fleet) recovered fuel costs. Conversely, highly dispatchable assets likely outperformed the average by avoiding low-margin hours, while non-dispatchable renewables faced significant 'cannibalization,' achieving prices well below the arithmetic average - see Figures 18 and 19 in the AESO’s Annual Market Statistics Report for more details.
On a quarterly level, the average price was CAD 43.02, the fifth-lowest level since 2005:
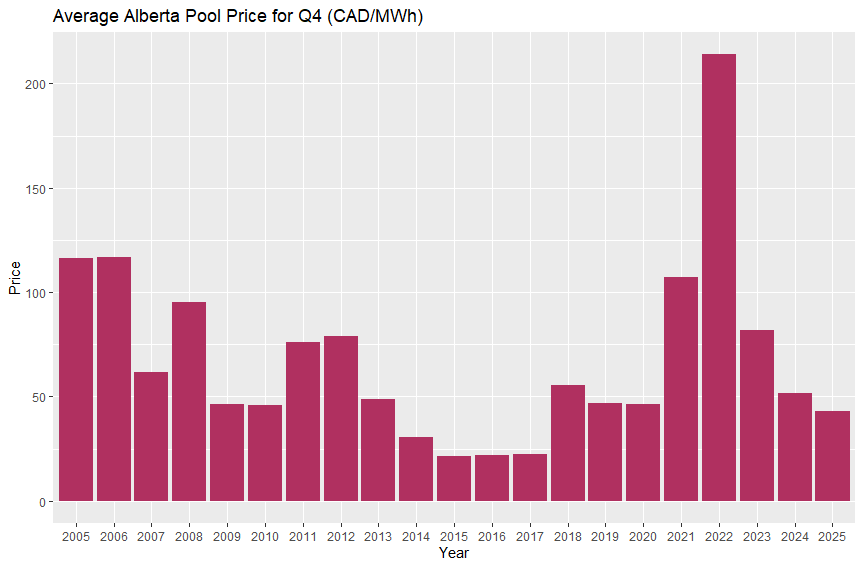
Q4 average Alberta electricity pool prices, 2005-2025 (CAD/MWh)
Prices are not inflation-adjusted
It thus appears that average price levels have started to stabilize. Averages tend to be very misleading however, and we have already seen in the heat map that both bookends of the allowed price range were present in December.
Accordingly, our proxy for the value available to flexible loads, the average of the lowest-cost daily 8 hours, was at the third-lowest level since 2005, at CAD 18.76/MWh, illustrating how price asymmetry has increased over the past two decades:
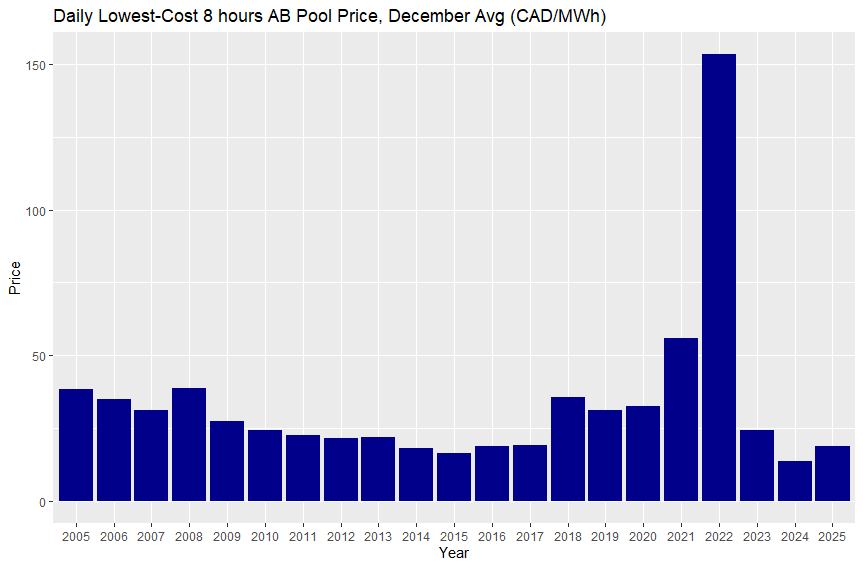
Daily lowest-cost 8 hours, average for December, 2005-2025 (CAD/MWh)
Prices are not inflation-adjusted.
Zooming out to a Quarterly perspective shows this trend even more clearly, with the average lowest-cost daily 8 hours at CAD 14.56/MWh, the lowest level in over two decades:
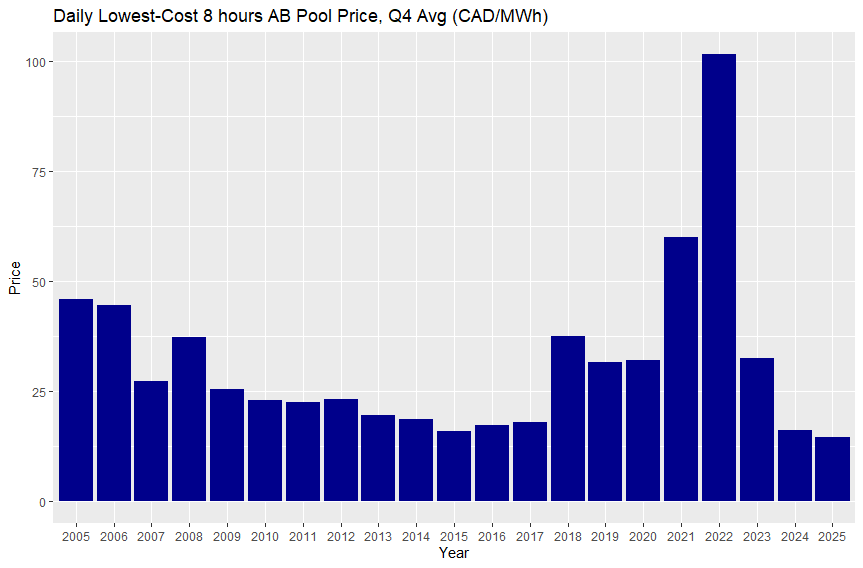
Daily lowest-cost 8 hours, average for Q4, 2005-2025 (CAD/MWh)
Prices are not inflation-adjusted.
This in itself is already remarkable - especially keeping in mind that these are nominal prices, not adjusted for inflation - the cheap hours are becoming VERY cheap.
And accordingly, zero-dollar hours set another monthly record - 65 out of December’s 744 hours were at zero, i.e. 8.7% of the time. Great for consumers with dispatchable / flexible loads!
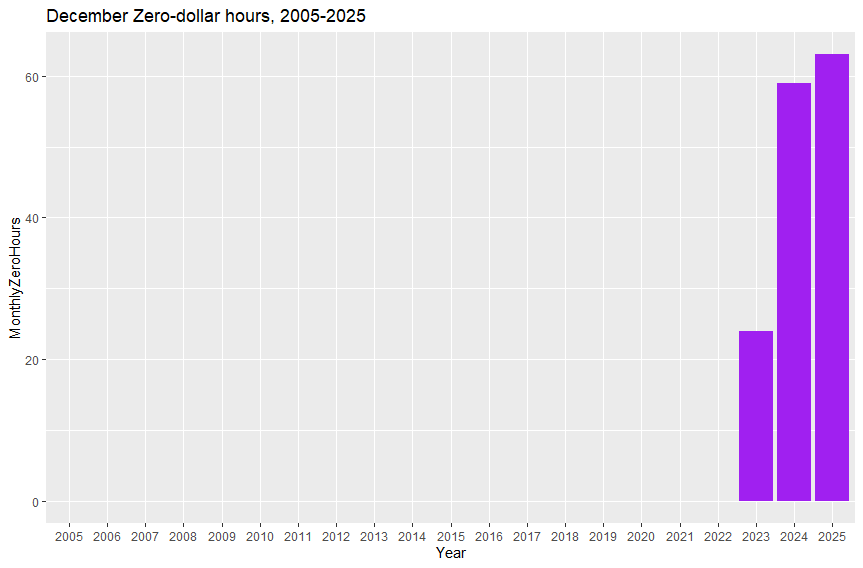
Monthly zero-dollar hours for December, 2005-2025
And again, we see this trend even more clearly from a quarterly perspective, with 256 zero-dollar hours representing 11.6% of all hours:
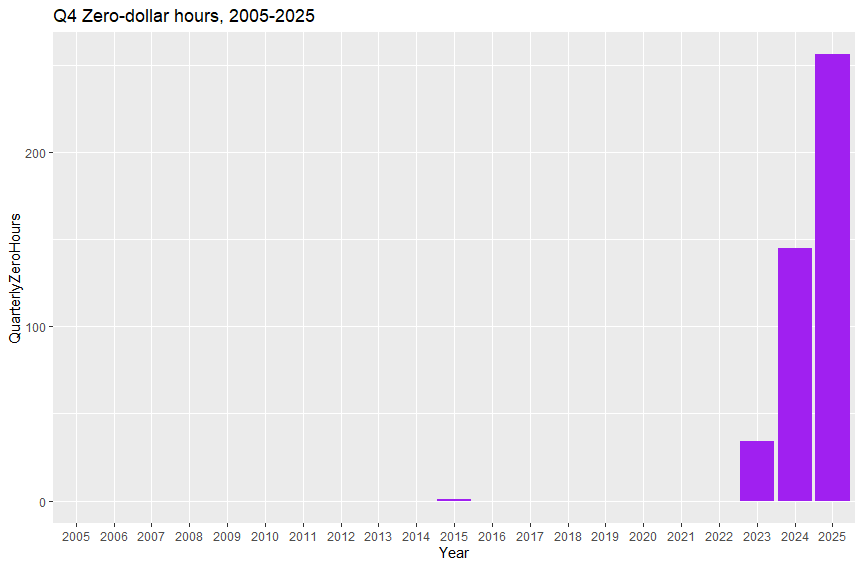
Zero-dollar hours for Q4, 2005-2025
Takeaways
As we noted in our introduction, the structural evolution of Alberta’s grid is no longer a forecast—it is clearly visible in the data. We are entering a period of further "stacked" transformation: massive load growth from data centers, the integration of utility-scale storage, and the most comprehensive regulatory overhaul in twenty years (REM, Tariff Redesign, and OTP).
These shifts represent a fundamental change in how power is bought and sold. While every consumer will be impacted, those with large industrial loads have the greatest agency to pivot. In a liberalized market, electricity is a controllable strategic variable, not a fixed cost. As the saying goes, “Proper Planning Prevents Poor Performance.” Now is the time to refine your strategy to ensure long-term resilience.
How Arder Energy Can Help
We are here to help you navigate this transition. Contact us today to schedule a 30-minute market assessment. Let’s explore immediate savings opportunities and build a roadmap for a cost-competitive power strategy.
Power Training for Deal Makers
Join us for a full-day training course covering the foundations of Alberta’s Electricity Market, designed for industry professionals and business leaders supporting the industry.
At the end of the course, you will be able to:
Decode industrial power bills and identify cost-saving opportunities
Negotiate more effectively with your electricity provider
Prepare for the implications of Alberta’s power market restructuring in 2026
The number of seats is limited to maximize opportunities for interaction and discussion, and we expect a sold-out event - sign up now!