
Alberta Power Market Snapshot: January 2026
Time flies—it feels like we just hit ‘publish’ on our 2025 Alberta Power Market lookback, yet the first month of 2026 is already in the books. As we are about to see, the structural shifts in power generation are still driving market developments, and we set a new record. Let’s dive in!
This article is for general informational purposes only and does not constitute financial, investment, or professional advice. Information is subject to change without notice and should not be relied upon for decision-making.
© 2026 Arder Energy™. All rights reserved. See Webpage Terms of Use.
The Data
As usual, we start with the big-picture view, the heat map of hourly pool prices:
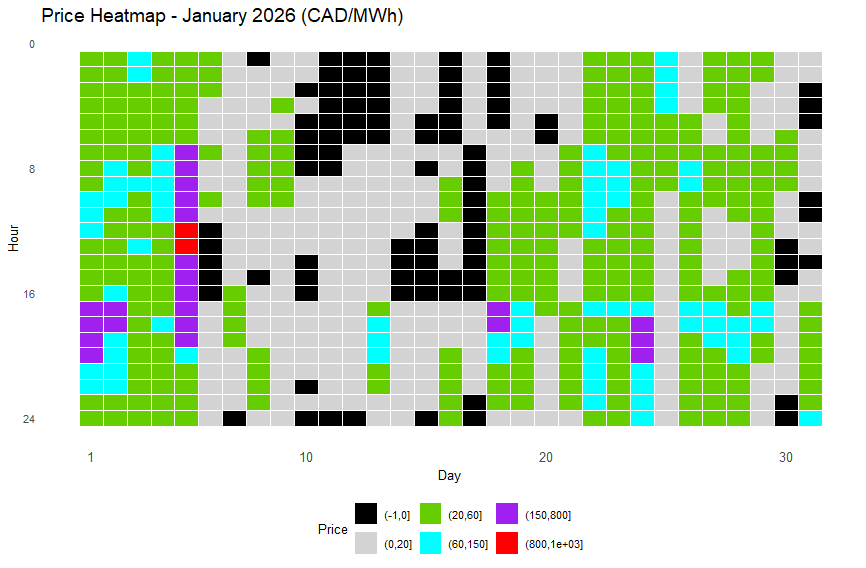
Heat Map of January 2026 hourly Alberta power pool prices
Black: zero dollar hour - “Excess Supply”
Light Grey: CAD 0.01 - 20/MWh - “Insufficient”
Green: CAD 20.01 - 60/MWh - “Marginal”
Cyan: CAD 60.01 - 150/MWh - “Full-cycle”
Purple: CAD 150.01 - 800/MWh - “Expensive”
Red: CAD 800.01 - 999.99/MWh - “Peak”
The month began with significant cold snaps, with daily highs often below minus 10 degrees C. It then started to warm and, importantly for power prices, became very windy especially in the southern part of the province, before the month ended with (near) record warm temperatures. Accordingly, we saw prices that were either “normal” or very expensive early on, with “peak” prices reached for a couple of hours on January 5th. And then, zero-dollar hours and extremely low prices became more prevalent again.
These rather volatile prices averaged out at CAD 39.44/MWh, the 6th lowest level since 2005, about 30% higher than last January’s average of CAD 30.36/MWh:
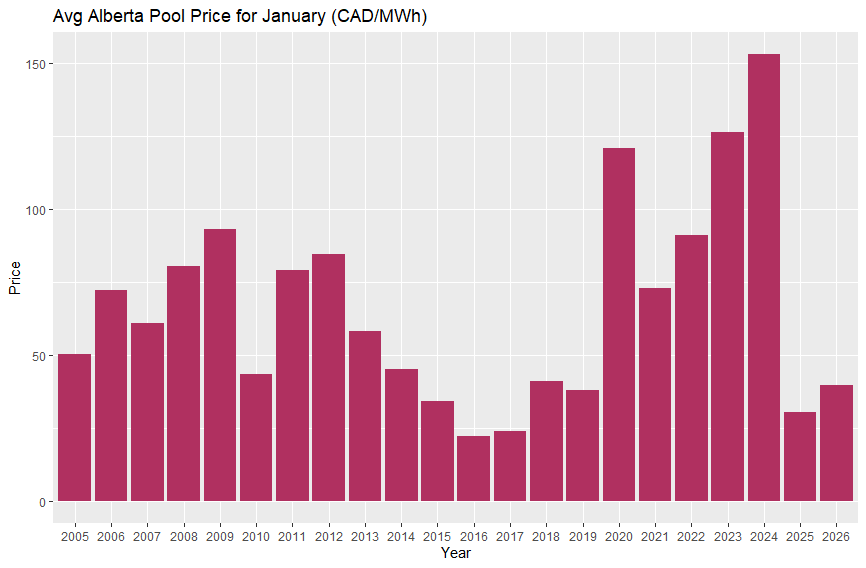
January average Alberta electricity pool prices, 2005-2026 (CAD/MWh)
Prices are not inflation-adjusted
Averages can be deceiving, and January provided a perfect case study. If you look at our proxy for the value available to flexible loads (the daily 8-hour low average), the price plummeted to CAD 13.11/MWh. To put that in perspective: we came within 0.6% of breaking the all-time record set last year.
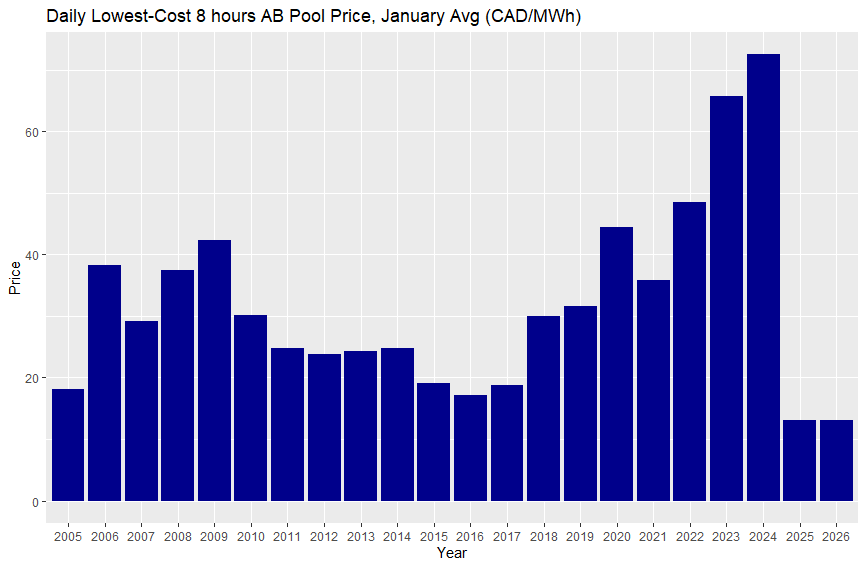
Daily lowest-cost 8 hours, average for January, 2005-2026 (CAD/MWh)
Prices are not inflation-adjusted
Our regular readers are likely most interested in the zero-dollar hour count, and January didn't disappoint. We hit a new peak of 91 hours, a 17% jump over last year's record. More importantly, this confirms the structural change in market dynamics: prior to last year, January had not seen a single zero-dollar hour in over two decades of tracking.
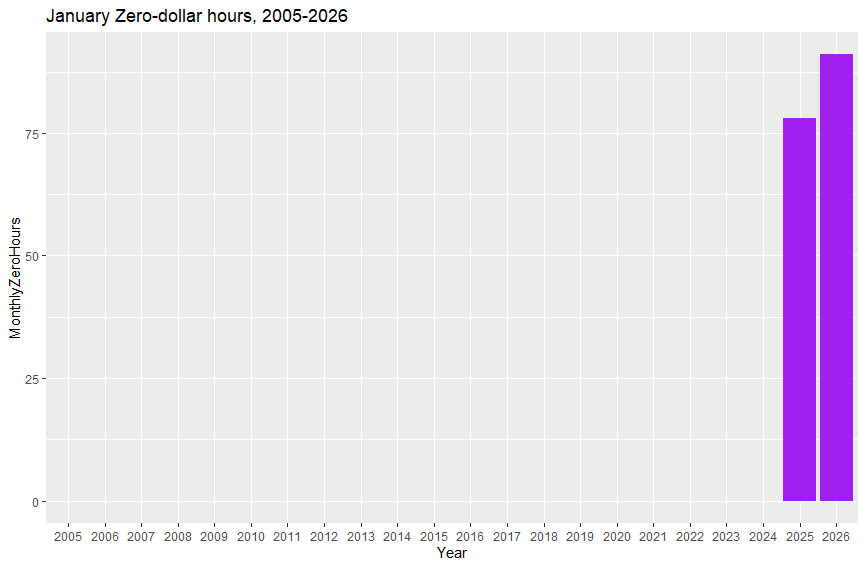
Monthly zero-dollar hours for January, 2005-2026
Takeaways
In short, consider the structural market shift driven by a new power generation mix confirmed. But surging load growth and regulatory overhauls are the next two waves heading our way. The takeaway for industrial consumers is clear: the days of passive electricity procurement are gone. In this new market, competitiveness belongs to those who treat power as a strategic variable, not just a line-item expense.
Don’t leave your power strategy to chance. Contact us today to start building a proactive roadmap for 2026.

Alberta Power Market Outlook: Free Webinar
Join us on February 12th for a concise webinar summarizing recent power market developments, what will shape 2026 and beyond, and explore implications with a focus on industrial power consumers.