Alberta-Power, Part 2: Averages, Tails and the Future
[This blog is not financial or investment advice, but provided for general information purposes only. All information is subject to change and should not be relied upon for any decision making. See Webpage Terms of Use.]
Part 1 of this Blog series introduced the significant changes coming to the Alberta power market.
This second part will illustrate:
The (very) high likelihood of very low and zero dollar hours on most days of the year for the foreseeable future
The unknowns associated with the significant build-out of renewables and upcoming regulatory changes
The possibility of an electricity market “supercycle” through accelerating demand, leading to continued generation growth despite increasing frequency of low-price hours
As outlined in the earlier article “Predictions are Hard, Particularly about the Future”, forecasts are often wrong, and for market participants it is more prudent to be prepared for multiple scenarios than to rely on a single forecast. The latter can lead to great successes if things work out exactly as planned, but it’s a much more risky approach. Part 3 will look at opportunities through the lens of some of the more likely scenarios.
As usual, any feedback especially on potential errors and accidental misinterpretations is most welcome - it’s a complex world!
The Details
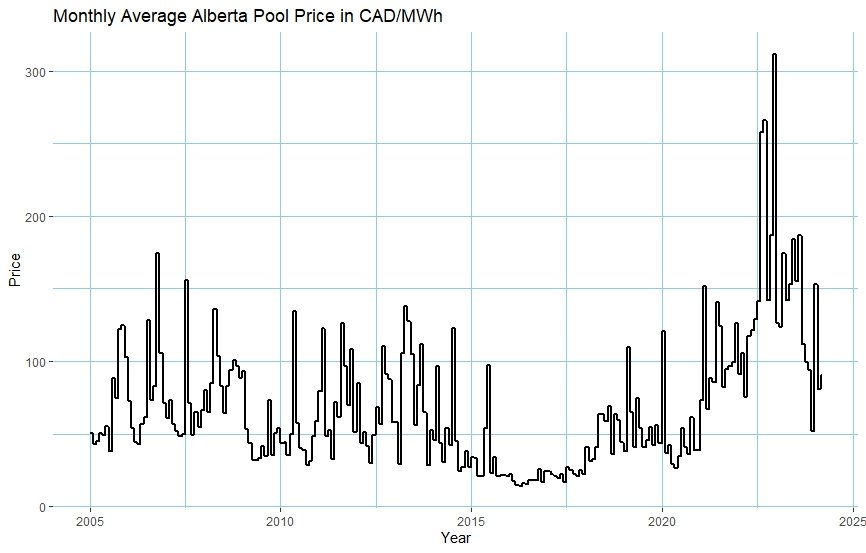
As a recap, here is the chart showing average monthly pool prices since 2005:
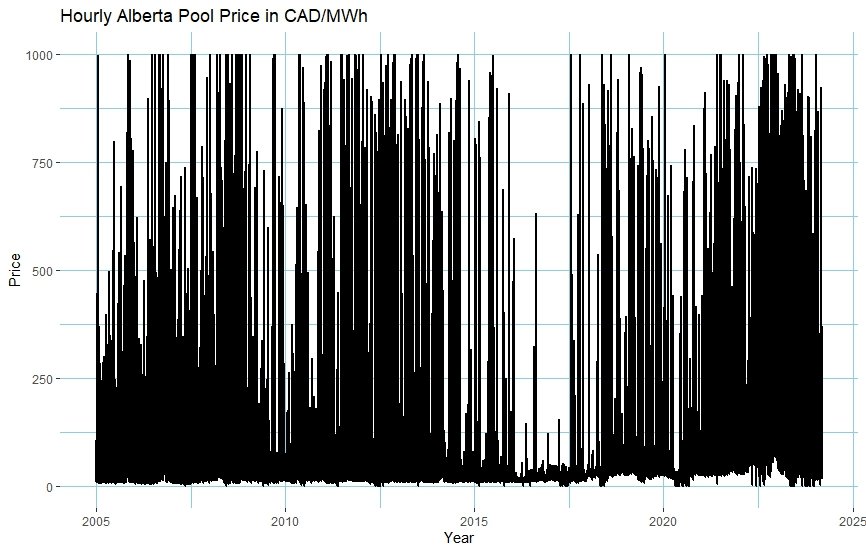
And here the same chart but with hourly instead of monthly average prices:
In summary, “If you keep your head in the oven and your feet in the freezer, on average you will be comfortably warm”. Or not.
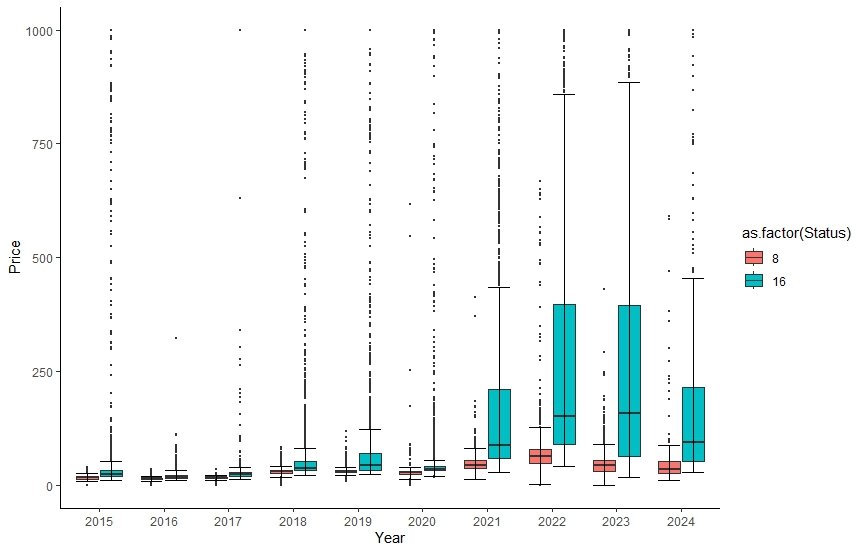
For more clarity, here is a boxplot of the average price over the cheapest 8 hours vs the remaining (“most expensive”) 16 hours per day, by year. The “box” shows the range between the first and third quartile, with the line in the middle depicting the median. The “whiskers” extend a further 1.5 times the interquartile range, and dots depict the outliers. In less technical terms, the box shows where the price of most of the average daily cheap and expensive hours is concentrated, and the whiskers and dots indicate the width of the overall range and outliers.
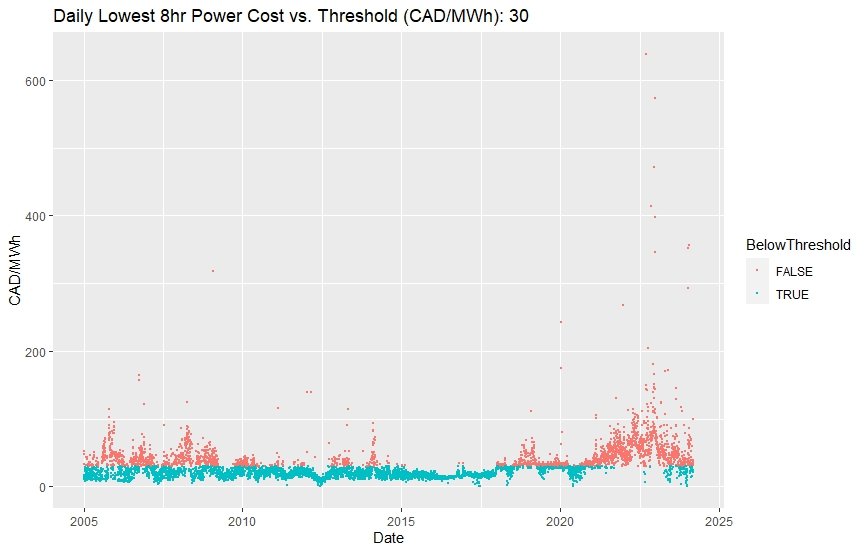
Thus even during the high-price years since 2021, the lowest cost 8 hours of each day still remained relatively low. Gas forward prices average around CAD 3.30/GJ from Q3/2024 forward (the very near term is more influenced by short-term demand & storage dynamics, thus excluded here), and gas power plants average a heat rate of around 8.5 GJ/MWh, thus average fuel cost is in the CAD 30/MWh range. When prices fall below that level and the “average” gas plant cannot cover its fuel cost, one can argue that prices are “low” - thus picking CAD 30/MWh here. (But ultimately the definition of “low” remains arbitrary - heat rates vary between ~ 6.8-11, variable Opex differs, etc).
Here a look at the daily average lowest cost 8-hour price since 2005, with red dots indicating that the respective daily average exceeded CAD 30/MWh and green dots indicating that the daily average was below CAD 30/MWh.
With the capacity additions outlined in Part 1 of this Blog, are we likely going to revert to the 2015-2018 regime with low average and very low lowest-cost hours? And if yes, for how long? Below an outline of reserve margin, “the firm generation capacity at the time of system peak that is in excess of the system annual peak demand, expressed as a percentage of the system peak”.
Excerpt from the AESO February 2024 Long Term Adequacy Report
Going by this graph, the reserve margin is likely to reach or exceed 2015-17 levels during the forecast horizon. This would indicate a high likelihood of much lower average prices and a lot more low-price hours. Note that this is firm generation capacity only, i.e. excluding non-dispatchable renewables. By nameplate capacity, these may make up ~90% of average Alberta Internal Load by end 2024. The huge increase in renewable capacity is likely to push low price hours even further down toward Supply Surplus (zero dollars) or even curtailments.
An important caveat - the market is fairly concentrated, and the Alberta Market Surveillance Administrator (MSA) has highlighted the likely occurrence of “withholding” in a recent report to the provincial government. Withholding can lead to substantially higher prices than pure incremental cost economics would indicate. Also, regulatory changes are on the way, and the provincial government has instructed the AESO and MSA to work together on a market redesign. Likely changes include restrictions on the ability to withhold generation capacity, changes to price floor / cap, etc. Again, this just shows that market participants should be prepared for various scenarios and not just rely on a single “forecast”.
Will the overall lower price environment again lead to a cycle of underinvestment? Possible, but we may also see a sort of “supercycle” with demand growth driven by demand from data centers, population growth and electrification of transport, combined with continued high demand for renewable Power Purchase Agreements (PPAs).
All that said, the likelihood of a substantial increase in very low or zero cost hours given the forecast capacity additions is very high, with big implications especially for those assets that cannot be dispatched effectively, like wind, solar and Cogen. Yet opportunities abound - more on that in Part 3.
Notes
The analysis is based on publicly available data only. Price histories obtained via the AESO’s ETS reports. Analysis in R, source code available upon request.


