
Alberta Power Snapshot - November 2024
[This article is not financial or investment advice, but provided for general information purposes only. All information is subject to change and should not be relied upon for any decision making. See Webpage Terms of Use.]
A month has passed since our October update, and it’s gotten cold, dark and at times windstill. And in turn, the Alberta power market got more interesting! Is the trend toward lower overall prices and sharply increased zero-dollar hours still intact, or was that a seasonal effect? Let’s have a look!
The Data
The price heat map for this month look a lot more complex than last month’s. We started the month with unusually warm weather, reducing demand. And then it quickly got cold and snowy, and often windstill. The power price heatmap clearly shows that shift around November 20th:
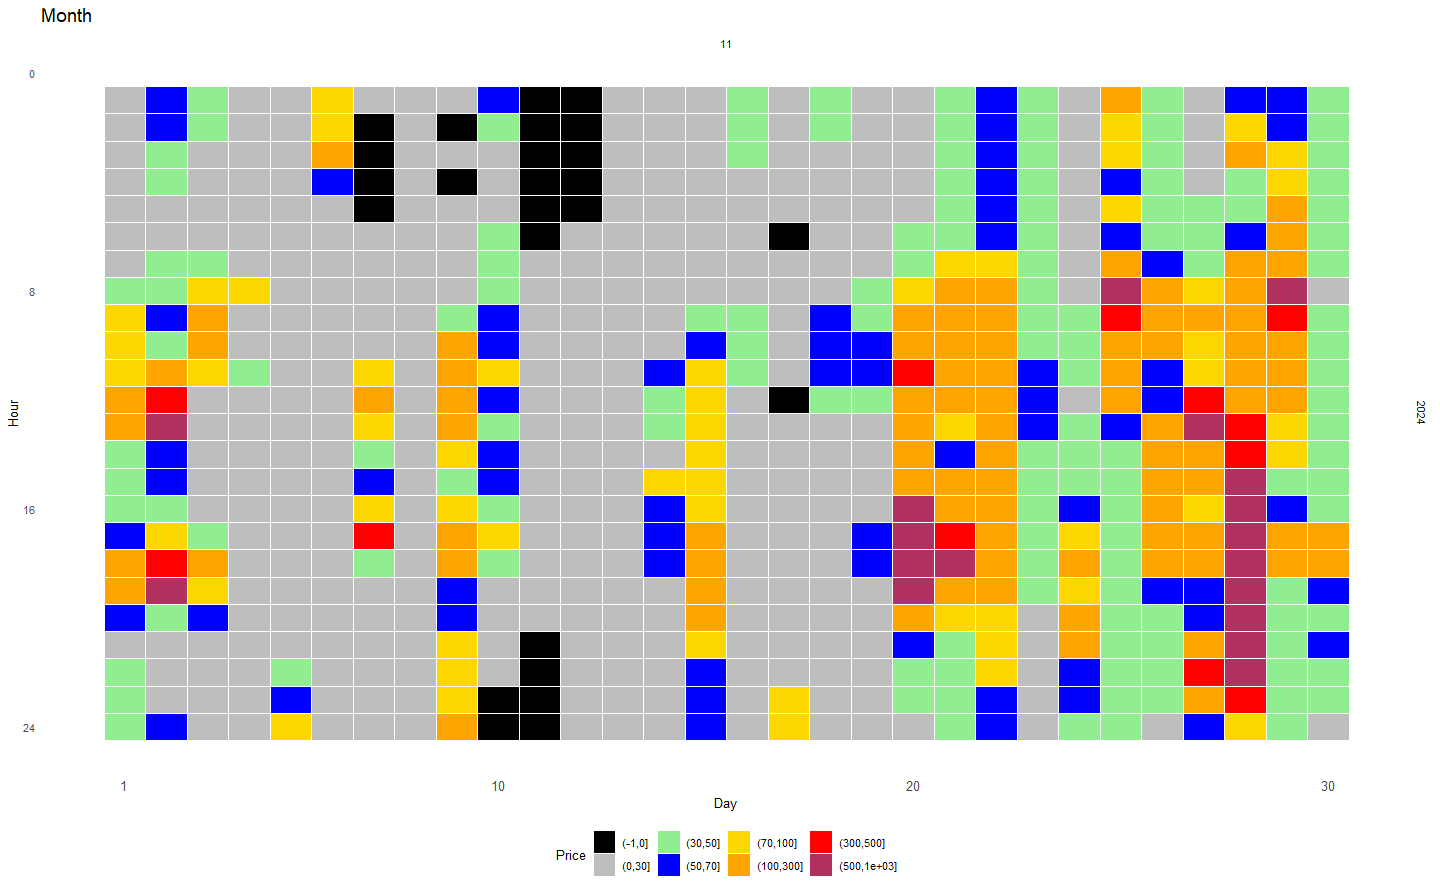
Heat Map of November 2024 hourly Alberta power pool prices.
Vertical axis: hour of the day, from hour 0 on top to hour 24 at the bottom.
Horizontal axis: day of the month, from 1st to 30th.
Colors: Hourly pool price, with each block representing one hour
black - “zero-dollar” (CAD 0/MWh);
grey - “ultra cheap” (CAD 0.01-30/MWh),
light green - “cheap” (CAD 30-50/MWh),
dark blue - “normal” (CAD 50-70/MWh),
yellow - “expensive” (CAD 70-100/MWh),
orange - “very expensive” (CAD 100-300/MWh)
red - “extremely expensive” (CAD 300-500/MWh)
maroon - “peak prices” (CAD 500-1,000/MWh)
What was the result of this dichotomy on key price metrics? First, let’s compare the monthly average price of CAD 71.20/MWh to that observed in November over the past 20 years:

November average electricity pool prices, 2005-2024 (CAD/MWh)
Prices are not inflation-adjusted.
We clearly see that while the average price was at the lowest November level since 2020, it is still significantly higher than around the middle of the last decade, even if it was adjusted for inflation. At Arder Energy, our focus remains on the lowest-cost 8 hours of each day though, as this is the price that drives the economics of large dispatchable loads like ETES units. And here, the story looks quite different:

Daily lowest-cost 8 hours, average for November, 2005-2024 (CAD/MWh)
Prices are not inflation-adjusted.
At CAD 21.54/MWh, the monthly average price of the daily cheapest 8 hours was at the lowest level since 2017, and not much higher than during the previous lows (despite the lack of inflation adjustment).
And that leads to the most interesting statistic of them all, the number of zero-dollar hours. What may look rather unimpressive in the heat map benefits from a big-picture view:

Zero-dollar hours in November, 2005-2024
Again not a data error - there were indeed no zero-dollar hours in November from 2005-2022, and only one in 2023, vs. 25 in 2024!
WOW!
While the absolute number of zero-dollar hours was substantially smaller than in October (25 vs. 61), the relative difference to prior years was even more extreme. The graph really says it all.
Conclusion & Outlook
Overall, we had another month providing evidence for the structural change underway in the Alberta power market, driven by the combination of inflexible “always on” Cogen power plants and non-dispatchable renewables. Next week, we’ll dive a bit deeper into supply & demand scenarios that show the extent to which this change is structural rather than just cyclical.
As for ETES solutions that profit from this development, we are looking forward to sharing more details on what we’ve been working on shortly.
Thus stay tuned! And if you have questions, feedback, or would like to explore project concepts, please get in touch.